The Whatcom Excavator
  • Home
    • About Us
    • Who's Planning Our Lives?
    • Diminishing Property Rights
    • NGO's & Public-Private Partners
    • Agenda 21
    • Buzzwords
    • Deep Thought
    • Best Available Science
    • Best Available Humor >
      • Humor Archive
  • The DREDGE
    • Gotta See This
    • How To Dredge
  • Bulldozed
    • Eco-Activism and County Policy
    • CELDF - "Democracy"
    • ALERT: Community Energy Challenge
  • Pig Trough
    • ReSources
    • Sustainable Connections
    • BALLE
    • ICLEI
    • Whatcom County Community Network
    • Big Wheels Award
  • Contact Us

Best Available Science | One Earth Year: Not Your Father's 365.25*

12/16/2013

0 Comments

 
Picture
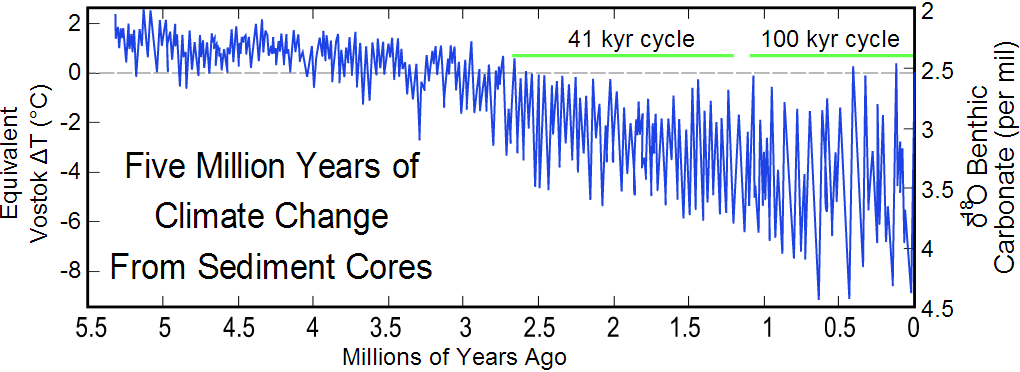
  Take a few minutes to learn about celestial mechanics and the eccentricity of Earth's orbit. The Earth's orientation to the Sun changes constantly. Orbital distance and the planet's tilt (celestial mechanics) drive weather, the seasons, and climate. Almost all of the eccentricity of Earth's orbit is related to the gravitational effect of other planets. This short video is eye candy, and brain food.   (Read more below the video.)  Turn your SOUND ON and enjoy the ride.

If the Earth were the only planet orbiting our Sun, the eccentricity of its orbit would not perceptibly vary even over a period of a million years. The Earth's eccentricity varies primarily due to interactions with the gravitational fields of Jupiter and Saturn. As the eccentricity of the orbit evolves, the semi-major axis of the orbital ellipse remains unchanged. From the perspective of the perturbation theory used in celestial mechanics to compute the evolution of the orbit, the semi-major axis is an adiabatic invariant. According to Kepler's third law the period of the orbit is determined by the semi-major axis. It follows that the Earth's orbital period, the length of a sidereal year, also remains unchanged as the orbit evolves. As the semi-minor axis is decreased with the eccentricity increase, the seasonal changes increase. But the mean solar irradiation for the planet changes only slightly for small eccentricity, due to Kepler's second law.
The Moon also exerts force that causes tides and other perturbations. All these factors change constantly, but long term cycles have been identified, and the relationship of celestial mechanics to life as we know it is important to understand.

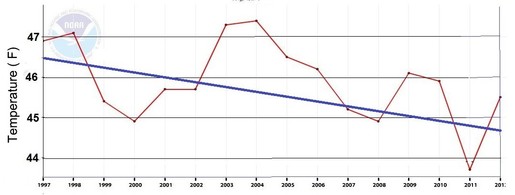
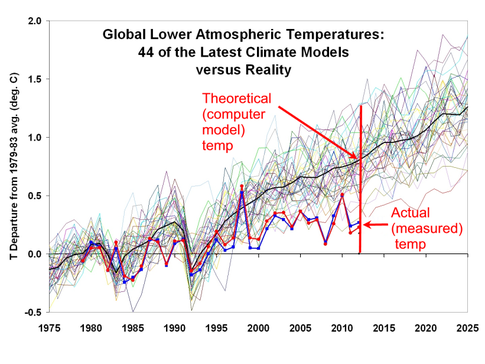
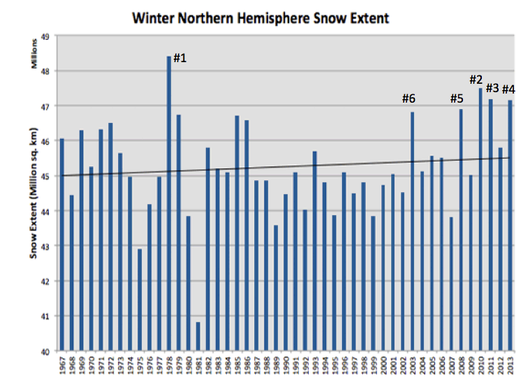
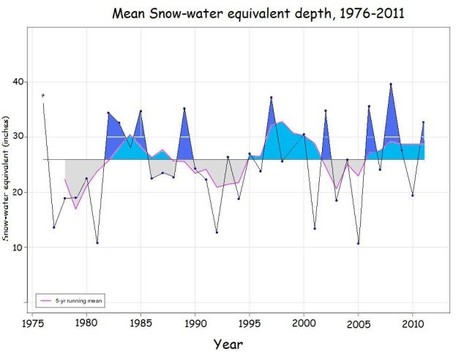
Celestial mechanics affect the length of days, years, and seasons - these vary more than most folks are aware of:
Picture
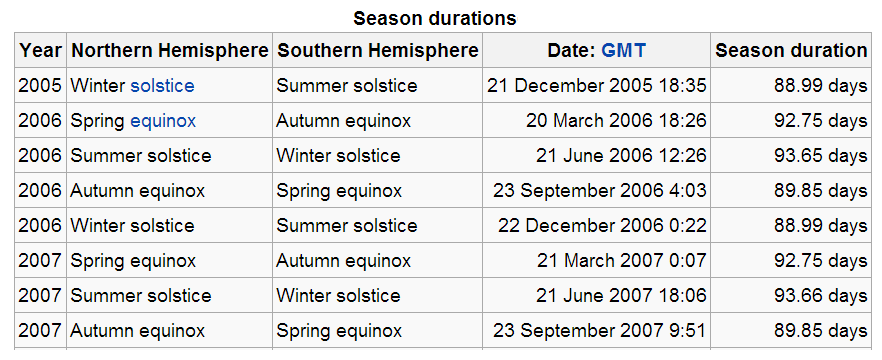
The relative increase in solar irradiation at closest approach to the Sun (perihelion) compared to the irradiation at the furthest distance (aphelion) is slightly larger than four times the eccentricity. For the current orbital eccentricity this amounts to a variation in incoming solar radiation of about 6.8%, while the current difference between perihelion and aphelion is only 3.4% (5.1 million km). Perihelion presently occurs around January 3, while aphelion is around July 4. When the orbit is at its most elliptical, the amount of solar radiation at perihelion will be about 23% more than at aphelion.

More info on these terms:  analemma, axial precession, sidereal year, tropical year, anomalistic year
Learn about Earth's movement through the heavens matter (what a ride!) and things like the "Milankovitch Cycle" (pros and cons) at NASA and Wikipedia and points beyond.

Picture

Is everything known about this topic, and does everyone agree?  Heck no, that's the beauty part of science. It's a process, not an end in itself which is best because there are all sorts of undiscovered and unanticipated objects and phenomena out there in the great beyond. We keep refining instruments and research methods, and new discoveries are made by the boldest thinkers that improve on well developed and long tested theories. Inquiring minds can research and build on all this by "standing on the shoulders of giants" like Copernicus, Newton, Galileo, and Kepler.

_____
*  FYI - the reference to "Your Father's 365.25" relates to the Julian calendar.  Wiki says:

A year (Old English gēar, Gothic jēr, Runic Jēran) is the orbital period of the Earth moving around the Sun. For an observer on the Earth, this corresponds to the period it takes the Sun to complete one course throughout the zodiac along the ecliptic.

In astronomy, the Julian year is a unit of time, defined as 365.25 days of 86400 SI seconds each (no leap seconds).[1]

0 Comments

Tales of Tyranny - Another Episode

12/13/2013

0 Comments

 
Bureaucratic pressure has become pretty serious here, where crimes against the bureaucracy can cost a fortune, and even land you in jail.  What kinds of crimes? Environmental crimes, like not filing a Farm Plan or not obtaining a Ground Disturbance Permit before digging a hole on your property.  But most victims are too afraid to fight back. Decent people are bullied into submission.  And a growing number of fines and extortion demands loom as mitigation banks and the "resources marketplace" are being set-up all around us, as a huge new financial industry.  WE think this county's becoming a green jail...  But we're not alone.

Some people think WE overuse the word "tyranny".  From Google:
tyr·an·ny
ˈtirənē/    noun
  1. cruel and oppressive government or rule. 
    "people who survive war and escape tyranny"
    synonyms: despotism, absolute power,  autocracy,  dictatorship,  totalitarianism, Fascism; 

It seems pretty cut-and-dried to us. Tyranny is just bureaucrats abusing power, taking peoples' liberty and jerking them around; like this:

Picture
Tales of Tyranny: Criminalizing Poverty in the San Juans - The Errol Speed Story
by Glen Morgan
December 11, 2013

Picture
From the front gate of Errol and Kathleen Speed’s 20-acre Orcas Island farm, they can glimpse a small stand of evergreen trees, an open meadow and their own, fenced organic garden. 

What they can’t see is why the local governing authority, San Juan County inWashington State, has chosen to treat them like criminals for committing what appear to be minor building code infractions.

Like many rural Washington residents, the Speeds live “off the grid” in a small trailer on the property they share with their horse, goats, and  chickens. They are neither wealthy, nor are they hardened criminals.

Consequently, they never expected to be subjected to a search warrant, charged with a criminal offense, tried before a jury of their peers, and sentenced to actual jail time for minor code violations involving their own property. 

The driving force behind Errol and Kathleen Speed’s nightmare is the bureaucrats’ relentless effort to criminalize minor infractions and victimless crimes. The Speed family’s experience is just the latest example, but it demonstrates the pointlessness of this over-criminalization effort by Big Government.


Picture
According to San Juan County law enforcement officials, the couple’s great crime was to erect a small building on their property, believing that structures less than 1,000 square feet were exempt from permit and building code requirements.  They also committed the great crime of having a bed, blankets, a couch, and a kitchen in this building.

They also used a composting toilet.

For their trouble, the Speeds endured a police raid of their property (using a criminal search warrant), a jury court trial, thousands of dollars in fines, and a 180-day jail sentence for Errol Speed. Not coincidentally, the county has spent tens of thousands of dollars in taxpayer money prosecuting the case.

“We built an accessory agricultural building with the understanding that we could build a building under 1,000 square feet with no fees, no permits and no plans,” Kathleen Speed said. “Normally in code violations, you work with the Planning Department and negotiate after the fact, and maybe there are additional fees. But in our case, we’ve been criminalized and treated as if we robbed a bank.”

“The justification for using a criminal search warrant was (that) we denied them (government officials) access,” Errol Speed said. “They never asked for access.”

While the couple doesn’t deny being in violation of at least some part of the code, the reality is that most people run afoul of some ordinance or minor law every day. Disputing these details hardly justifies the effort San Juan County has made to prosecute the Speeds.

In the area of home ownership and private property, few properties are immune to potential violations. In modern times, most people have become numb to the ever-expanding ordinances and the new thousands of pages of rules and regulations that apply to every property owner in the local jurisdiction. 

In most cases, there is little concern over these ordinances because it would take a police state to actually enforce them, and most people feel they could appeal to common sense or pay a small fine to resolve the problem.


Picture
Picture
From left - Prosecutor Randy Gaylord, San Juan County Sheriff Rob Nou, Judge Stewart Andrew
Picture
The complicity of at least three elected officials is needed to formally charge Errol Speed for committing a crime. These include San Juan County Sheriff Rob Nou (elected in 2010), San Juan County Prosecutor Randall Gaylord, and San Juan County District Court Judge Stewart Andrew. Without the formal sign-off and approval by all three of these elected officials, the Speed family could not be criminally prosecuted. If even one of these elected officials believed that prosecuting the Speed family was not a priority, they could have stopped this criminal trial from even starting.  San Juan County does have real crime problems. At least four people have died of heroin overdoses in just the past 12 months, but apparently prosecuting the Speed family is more important to these elected officials. 

Andrew was originally a California attorney who relocated to San Juan County and has been a judge since 1998. Gaylord has been in office for 20 years, and he is best remembered for his successful effort to ban personal watercraft in San Juan County in 1996 and for his failed effort to suppress free speech in 2005 when he filed suit against local radio talk show hosts for opposing a gas tax increase. 

In 2010, the Heritage Foundation published a booklet titled, “One Nation Under Arrest,” (co-authored by the Freedom Foundation’s Trent England), detailing many cases around the country of an explosion of laws—federal, state and local—which have created thousands of new “crimes” that can justify criminal search warrants, jury trials and jail time.

No victims or common sense are necessary in this process. Errol Speed discovered what it’s like to personally experience a “Crime Against Bureaucracy” in San Juan County. 

Unfortunately, he isn't likely to be the last.

Picture
0 Comments

Water, water every where - Nor any drop to drink

12/6/2013

1 Comment

 
Picture
WE suppose you know that northwest Washington is a rain forest. What you may not know is that some people are trying to gin up the idea that water is scarce around here; that we're on the brink of a water shortage (or something), and (wait for it) that water needs to be rationed by a cadre of self-appointed busybodies and shake-down artists. Radical curtailment of both access to water and land use are being actively discussed right here in Whatcom County.  Is there a target on private landowner's backs?  Yes, indeed there is.

WE suppose further that you know water isn't consumed; it's recycled. Every drop of water that has ever been drunk, polluted, used to generate electricity, irrigate crops, or anything else - is still present on planet Earth. We're drinking the same water that was swallowed and subsequently peed out by Jesus Christ, Sir Isaac Newton, Adolph Hitler, Josef Stalin and millions of others.  Mother Nature is the greatest recycler of all.

Well (no pun intended), WE were alerted to this story (it's about Skagit County, but don't think Whatcom County is very far behind; it isn't):


Got WATER ? Maybe Not

Private water well owners' rights were just usurped by a WA Supreme Court case decision. For now, the Department of Ecology says they will not shut down anyone’s private well. What about in the future? If the State controls private water rights they control much, much more.

This petition may make it around to various lists, but sign it once and pass it on through email, Facebook, Twitter, etc.  A maximum number of signatures is needed to impress upon our state senators and representatives that corrective legislation is needed.  Our neighbors in rural Skagit County and throughout the state have a right to the water on their land. 

Please sign the petition in support of basic legal access to water for rural citizens in the Skagit Watershed. We support a balanced approach, but it must include water for tax-paying citizens!

Please send this to everyone (including organization membership lists) you know that are supportive of water for rural farmers and landowners across the state. While our problem here presents a unique set of past circumstances, it is a statewide issue. Let our legislators know we need a legislative solution now.
1 Comment

Letter to Editors - Some Cold Hard Truth About Our Local Glaciers

11/24/2013

18 Comments

 
Picture^ Click ^

WE Editors, science-types, are constantly amazed at the sheer volume of panicky and convoluted narrative about climate and water that passes for "news" in the local press. WE are not alone. For the cold, hard truth about our local climate and glaciers, read on.

Letter to [email protected]
November 24, 2013

     On Wednesday, Nov. 20, Michelle Koppes gave a talk to the Bellingham City Club, which was featured in the Bellingham Herald (“Bellingham audience told glaciers, oysters show climate change impacts”) and on the city’s TV program. Koppes claimed that

(1)    The climate is warming and “it’s not just happening here, it’s happening all over the world.”   Human emissions of CO2 are causing global warming and warming is “expected to get worse as average temperatures keep trend up in the decades ahead. And the uptrend is expected to accelerate in the 21st century.”
(2)    “here and almost everywhere else in the  world, the mountain snow accumulations that feed the glaciers are dwindling.”
(3)    “The amount of water stored in mountain snow is down 45 to 60 percent since 1950.”
(4)    “shrinkage of Cascade glaciers seems to be accelerating”….”glaciers on Mt. Baker…..have lost 20 percent of their volume since 1990.“

     Are these assertions by Koppes valid and supported by credible data? What supporting evidence did she present as proof of her contentions? Let’s look at each of her claims.

     (1)  What evidence did Koppes cite that the climate is warming here and all over the world?  The answer is simple—none at all.  She simply states that the climate is warming, despite indisputable data to the contrary.  But there is abundant data concerning this issue. As shown by temperature measurements from both land stations and satellites, NO global warming has occurred for the past 17 years! Figure 1 shows that global cooling has actually occurred during the last decade.
Picture
Figure 1. Global temperature for the past decade has cooled, not warmed.

Even the chairman of the UN IPCC (Intergovernmental Panel on Climate Change) has publicly admitted that there has been no global warming for the past 17 years. So why did Koppes tell the City Club that the global climate and the climate here is warming at an accelerating rate? Can she really be unaware of the uncontested fact that data shows no global warming in the past 17 years when virtually all other scientists know about it.?

That’s the global situation—what about the U.S.? NOAA data shows that from 1998 to 2013, 46 of the 48 mainland states cooled at an average rate -14.7°F per century and winter temperatures have cooled at rates of 1-8.7°F per decade (Fig. 2), i.e, the climate isn’t warming, it’s cooling!
Picture
Figure 2. Winter temperatures in the north central have cooled by more than 8°F per decade and the rest of the US has cooled at rates of 1.3 to 5.8 °F.
     What about local temperature trends? NOAA data show that Washington winters have cooled at a rate of -13°F per century, spring temperatures have cooled at a rate of -7.8°F per century, and summers have cooled at a rate of 0.5°F per century.

What about local temperatures here? Figure 3 shows that average annual temperatures for the western Cascades over the past 15 years have cooled by more than a degree and a half!
Picture
Figure 3. Average annual temperatures for the western Cascades for the past 15 years show cooling of more than a degree and a half.
So where did Koppes get the idea that the climate is warming at an accelerating rate?  Apparently she is still quoting obsolete IPCC computer model temperatures that have been proven to be wrong (too warm) by a full degree F and are totally worthless.  Even the IPCC admits that their computer modeled temperatures were badly wrong. The bottom line here is that the ‘accelerated warming’ cited by Koppes is NOT happening and she ignores the actual measured temperature record that is accepted by even the IPCC!
Picture
Figure 4. Reality check—theoretical (computer modeled) temperature relative to actual, measured temperature (from UAH and RSS satellites). Computer models of the temperature in 2012 were wrong by one full degree (F), (which is as much as the total amount of warming during the past century), showing that the IPCC computer model temperatures are a hopeless failure.


     (2)  Koppes claims that “here and almost everywhere else in the world, the mountain snow accumulations that feed the glaciers are dwindling.” Data is available (Fig. 5) and it shows that five of the six snowiest years in the Northern Hemisphere have occurred since 2003 (NOAA).
Picture
Figure 5. Snow extent in the Northern Hemisphere.
     (3)  Koppes claims that “The amount of water stored in mountain snow is down 45 to 60 percent since 1950.” The snowpack in Washington goes up and down from year to year, but the snow-water equivalent in Washington in the past 25 years has been growing, not declining as claimed by Koppes (Fig. 6). How she could claim a 45 to 60 percent decrease in snow-water equivalent is amazing.
Picture
Figure 6. Mean snow water equivalent in the Cascades since 1975.
     (4)  “...shrinkage of Cascade glaciers seems to be accelerating”… Glaciers advance and retreat as climate warms and cools.  Koppes seems to be unaware of many published papers showing that Mt. Baker glaciers advanced almost to their Little Ice Age (1300 to 1915 AD) positions during the 1880 to 1915 cold period, then retreated strongly upvalley during the 1915 to 1945 warm period (WITHOUT ANY SIGNIFICANT INCREASE IN CO2!). This is important because it shows that Mt. Baker glaciers retreated upvalley well before CO2 began to increase significantly from 1945 on, i.e., CO2 cannot be the cause of this glacier retreat.  The climate turned cooler again from 1945 to 1977 and the glaciers readvanced about twice as far downvalley as they had retreated during the 1915 to 1945 recession, all during the time of maximum CO2 emissions (after 1945)!  This is even more important, because it shows that for ~30 years (~1945-1977) during the sharpest increase in human CO2 emissions, glaciers on Mt. Baker advanced strongly, just the opposite of what they should have done if CO2 causes warming. In 1978, the climate warmed again and the glaciers have again retreated upvalley. Thus, Koppe’s contentions that Cascade glaciers are retreating at an accelerating rate totally ignores the strong glacier advance from 1945 to 1980 when CO2 was soaring. 

     Koppes claims that "glaciers on Mt. Baker…..have lost 20 percent of their volume since 1990."  This one is mind-boggling!  Fig. 7 shows the amount of retreat of the Coleman glacier terminus from 1993 to 2011 and the total length of the glacier. Keeping in mind that glaciers thicken rapidly upvalley from their terminus, the total amount of ice loss since 1990 can’t be more than a few percent. Other glaciers show the same relationship. How any competent glaciologist could come to such a conclusion is hard to imagine.
Picture
Figure 7. Diminished length of the Coleman glacier from 1993 to 2011(red enclosed area). Looking at Figure 7, it is hard to imagine how any competent glaciologists could conclude that.
CONCLUSIONS

Considering all of these easily confirmed facts that Koppes omitted, her conclusions are badly flawed (some are outright falsehoods) and her contentions are not scientifically defensible.


                                                           Dr. Don Easterbrook, PhD
18 Comments

National Geographic Rising Sea Level Prophecy - Cause for Concern or Absurd Fairy Tale?

10/20/2013

1 Comment

 
By Don J. Easterbrook, Ph.D.

The September issue of National Geographic shows sea level midway up the Statue of Liberty, 214 feet above present sea level (Fig. 1) and contains dire images of impending catastrophic sea level rise. Anthony’s excellent responses (http://wattsupwiththat.com/?s=national+geographic) and
(http://wattsupwiththat.com/2010/11/28/freaking-out-about-nyc-sea-level-rise-is-easy-to-do-when-you-dont-pay-attention-to-history/) have demonstrated the utter absurdity of the National Geographic portrayal.   
Picture
Figure 1. Cover of October issue of National Geographic.
As Anthony points out, at the rate of sea level rise shown by tide gauge records since 1856 at The Battery 1.7 miles away, for sea level to reach that high up the Statue of Liberty would take 23,538 years!

But what about the other assertions in the National Geographic article, such as (1) many graphic images of what the future holds, (2) smaller, but still unreasonable sea level rise, (3) doomed cities (Miami and London gone), (4) flooded coastal areas (most of southern Florida submerged), (5) more frequent storm surge disasters due to sea level rise, and (6) various other catastrophic scenarios? Are any these cause for concern or are they also just unfounded, fear-mongering scenarios aimed at getting attention? Let’s look at some the contentions in the National Geographic scenarios.

  1. "By releasing carbon dioxide and other heat-trapping gases into the atmosphere, we have warmed the Earth by more than a full degree Fahrenheit over the past century and raised sea level by about eight inches. Even if we stopped burning all fossil fuels tomorrow, the existing greenhouse gases would continue to warm the Earth for centuries. We have irreversibly committed future generations to a hotter world and rising seas."
  2. "…the big concern for the future is the giant ice sheets in Greenland and Antarctica." "If the Thwaites Glacier breaks free from its rocky berth, that would liberate enough ice to raise sea level by three meters—nearly ten feet."
  3. "by the time we get to the end of the 21st century, we could see sea-level rise of as much as six feet globally instead of two to three feet. Last year an expert panel convened by the National Oceanic and Atmospheric Administration adopted 6.6 feet (two meters) as its highest of four scenarios for 2100. The U.S. Army Corps of Engineers recommends that planners consider a high scenario of five feet." "we’re already locked in to at least several feet of sea-level rise, and perhaps several dozens of feet"
  4. "Inexorably rising oceans will gradually inundate low-lying areas" "By the next century, if not sooner, large numbers of people will have to abandon coastal areas in Florida and other parts of the world." "With seas four feet higher than they are today—a distinct possibility by 2100—about two-thirds of southeastern Florida is inundated. The Florida Keys have almost vanished. Miami is an island."
  5. "A profoundly altered planet is what our fossil-fuel-driven civilization is creating, a planet where Sandy-scale flooding will become more common and more destructive for the world’s coastal cities." "…higher seas will extend the ruinous reach of storm surges. The threat will never go away; it will only worsen. By the end of the century a hundred-year storm surge like Sandy’s might occur every decade or less."
  6. "…carbon dioxide in the atmosphere will reach around a thousand parts per million by the end of the century," "According to the U.S. Geological Survey, sea level on an iceless Earth would be as much as 216 feet higher than it is today. It might take thousands of years and more than a thousand parts per million to create such a world—but if we burn all the fossil fuels, we will get there."
  7. "by 2070, 150 million people in the world’s large port cities will be at risk from coastal flooding, along with $35 trillion worth of property."

These 7 statements are not as obviously ridiculous as the depiction of a 216 foot sea level rise at the Statue of Liberty, but all carry ominous consequences if true. Are any of these contentions realistic? Let’s consider real-time scientific data for each of them.

 1.    Has carbon dioxide warmed the Earth by more 1º F over the past century?

Carbon dioxide is a trace gas that makes up only 0.039% of the atmosphere, accounts for only 3.6% of the greenhouse effect, and has increased by only 0.009% since 1950. By itself, it is incapable of warming the climate by more than a fraction of a degree. With no physical evidence that CO2 causes significant atmospheric warming, the IPCC rely solely on computer models, but because the effect of CO2 is so small, they introduce an increase in water vapor (which is responsible for 95% of greenhouse warming), claiming that as CO2 goes up so does water vapor. For models to be valid, a real-world atmospheric water vapor must go up, but just the opposite is true—water vapor has gone down since 1947 (Fig. 2). Thus, climate models have been an utter failure (Fig. 3).
Picture
Figure 2. Declining atmospheric water vapor since 1947.
Picture
Figure 3. Failure of climate models to match reality. Dark line is average temperature predictions of 44 models; red and blue lines are actual temperatures.
The National Geographic claims that CO2 has caused 1º F of warming this century. But CO2 didn’t begin to rise sharply until after 1945 so cannot have been a factor before then. Temperature data shows that 0.7° C of warming occurred from 1900 to 1945, before CO2 could have been the cause and while CO2 emissions soared from 1945 to 1977, global temperatures declined (just the opposite of what should have occurred if CO2 causes warming), and only 0.5°C warming from 1978 to present coincided with rising CO2 (and that is very likely coincidental). 
Picture
Figure. 4. Temperature changes during the past century.
Much additional data showing the CO2 is of little significance in global warming is summarized in the Nongovernmental International Panel on Climate Change 2013 report “Climate Change Reconsidered II: Physical Science.” This 1200 page report convincingly and systematically challenges IPCC claims that carbon dioxide is causing “dangerous” global warming and that IPCC computer models can be relied on for future climate forecasts.

Conclusions: National Geographic’s statement that CO2 caused 1º F of global warming this century is contrary to scientific evidence and is thus false.  

2.   “…the big concern for the future is the giant ice sheets in Greenland and Antarctica.” “If the Thwaites Glacier breaks free from its rocky berth, that would liberate enough ice to raise sea level by three meters—nearly ten feet.”

That this is not going to happen is shown by (1) there is no evidence that this has ever happened in the past and several factors insure that it won’t happen any time soon, (2) Antarctic glaciers are frozen to their base and move by internal flowage of ice, not by basal sliding, (3) these ice sheets lie in basins, and (4) the Greenland ice sheet is behaving just as it has in the geologic past and there is nothing unusual happening to it now. 

Conclusion: The likelihood of ice sheets in Greenland and Antarctic sliding into the sea is essentially zero.

3.  “by the time we get to the end of the 21st century, we could see sea-level rise of as much as six feet globally instead of two to three feet. Last year an expert panel convened by the National Oceanic and Atmospheric Administration (NOAA) adopted 6.6 feet (two meters) as its highest of four scenarios for 2100. The U.S. Army Corps of Engineers recommends that planners consider a high scenario of five feet.” “we’re already locked in to at least several feet of sea-level rise, and perhaps several dozens of feet.”

How realistic are these predictions of sea level rise of six feet to several dozens of feet? To answer that, all we have to do is look at the sea level rise for the past century and compare it with the National Geographic projection. Sea level has risen 7 inches in the past century at a relatively constant rate of 1.7 mm/yr from 1900 to 2000 (Fig. 5) and has actually shown signs of decline in the past few years (Fig. 6).
Picture
Figure 5. Sea level rise of 1.7 mm/yr from 1900 to 2000.
Picture
Figure 6. Sea level rise since 1993.
Picture
Figure 7. Sea level rise over the past century (lower left), sea level rise projected at this rate (black line, lower part of graph), and IPCC predicted sea level rise (red).
 The difference between the sea level rise projected from actual rise over the past century and the catastrophic scenario of the National Geographic is 15 times the rate of sea level rise over the past century! Two questions immediately arise: (1) what is going to cause such accelerated sea level rise and (2) where is all the water going to come from? The accelerated rise is based on postulated accelerated warming but there has been no warming in the past 15 years (in fact, the climate has cooled during that time (Figure 8). So no climatic warming means no accelerated sea level rise as postulated by the National Geographic .
Picture
Figure 8. Cooling of -0.23°C per century over the past decade. (modified from Monckton, 2013)
In order to get the accelerated sea level rise postulated by National Geographic, much of the Greenland and Antarctic ice sheets would have to melt. However the Antarctic ice cap is growing, not melting, and the Greenland ice cap was about the same size as at present during the Holocene Climatic Optimum. Morner (2011) has pointed out that, even during warming 20 times more intense than recent warming, melting of the massive Pleistocene ice sheets that covered vast areas resulted in sea level rise no greater than one meter per century. Thus, now that these great ice sheets are gone, there is no source of water for sea level rise even approaching one meter, so any prediction of sea level greater than that cannot be considered credible. The National Geographic scenario of the rate of sea level rise of six feet would require a rate of sea level rise of 20 mm/yr. in contrast to the rate of 1.7 mm over the past century. 

Conclusion: These data demonstrate that the scenario painted by the National Geographic of very large rise of sea level by 2100 is contrary to all physical scientific data and therefore its credibility must be totally rejected.

4.  “Inexorably rising oceans will gradually inundate low-lying areas” “By the next century, if not sooner, large numbers of people will have to abandon coastal areas in Florida and other parts of the world.” “With seas four feet higher than they are today—a distinct possibility by 2100—about two-thirds of southeastern Florida is inundated. The Florida Keys have almost vanished. Miami is an island.”

How credible is submergence of two thirds of Florida by 2100, leaving Miami as an island? Figure 9 shows that sea level rose 7 inches at a constant rate (2.24 mm/yr) during the past century at Key West (which is representative of southern Florida sea level rise). Projection of that rate to 2100 (Fig. 9) would result in a sea level rise of 6 inches by then. Contrast this with the National Geographic projected sea level rise of 21 mm/yr. What could possibly cause such a huge, sudden change in the rate of sea level rise? The answer is that it is not even close to being credible because (1) with no global warming in the past 17 years there is no reason for such a change, (2) there is no source of water--the East Antarctica ice sheet is not melting and Greenland has been warmer for thousands of years in the past without melting its ice sheet, (3) Antarctic sea ice is increasing, setting records, and (4) even during the rapid, intense melting of huge ice sheet at the end of the last Ice Age, sea level didn’t rise this fast. Continuation of sea level at the constant rate of the past century would result only in a sea level rise of about 3-4 inches per generation.
Picture
Figure 9. Sea level rise at Key West, Florida from tidal gauge records (Blue curve); sea level rise projected to 2100 at the rate over the past century; sea level rise postulated by National Geographic (red line).
Conclusion: The National Geographic projection that two thirds of Florida will be submerge by 2100 is contrary to data and lacks any possible mechanism to increase sea levels more than a few inches. The National Geographic scenario is therefore totally without any credibility. 

5.  Are the National Geographic statements “…higher seas will extend the ruinous reach of storm surges.” and “By the end of the century a hundred-year storm surge like Sandy’s might occur every decade or less.” credible?

There is no scientific evidence that storm frequency or intensity has increased over the past century. Figure 10 shows no increase in hurricane power dissipation index since 1900 and the US has experienced the longest period with no hurricanes making landfall (the Sandy storm was not strong enough to be considered a hurricane).
Picture
Figure 10. Hurricane index for the US since 1900.
Conclusion: The National Geographic conclusion that higher sea levels“higher seas will extend the ruinous reach of storm surges” is not credible because (1) sea level rise is too small to significantly affect storm surges, and (2) the hurricane strength index is now lower than it was earlier in the century.

6.  “by 2070, 150 million people in the world’s large port cities will be at risk from coastal flooding, along with $35 trillion worth of property.

As shown in the data presented above, none of the National Geographic sea level projections are even remotely believable and sea level projections based on tide gauge records for the past century indicate that sea level will most likely rise 4-6 inches by 2070. 

Conclusion: The National Geographic contention that 150 million people and $35 trillion worth of property is nothing more than a fairy tale, totally contrary to data that indicates that sea level will rise only a few inches by 2070.

7.  “…carbon dioxide in the atmosphere will reach around a thousand parts per million by the end of the century,” “According to the U.S. Geological Survey, sea level on an iceless Earth would be as much as 216 feet higher than it is today. It might take thousands of years and more than a thousand parts per million to create such a world—but if we burn all the fossil fuels, we will get there.”

The National Geographic issue contains many elaborately constructed images under the header of “If all the ice melted,” depicting submergence of extensive coastal areas all over the world and contending that “if we burn all the fossil fuels, we will get there.” What’s wrong with this? For openers, it would require melting of the entire Antarctic ice sheet, the Greenland ice sheet, and all of the world’s ice caps and alpine glaciers. Is this possible? Considering the data presented above, it is, of course ridiculous with no trace of credibility. In addition, the Antarctic ice sheet has not melted in 15 million years, including during many interglacial periods when global temperatures were significantly higher than at present for thousands of years.

Summary of conclusions: From the evidence presented above, the obvious conclusion is that the National Geographic article is an absurd fairy tale, completely unsupported by any real scientific data and directly contrary to a mountain of contrary evidence.

Don J. Easterbrook is professor of geology at Western Washington University.
1 Comment

The Tangled Web They Weave

10/20/2013

0 Comments

 
WE saw an article over at WhatcomWatchdog that you may have missed:

I spent some time looking into the background of the PowerPastCoal.org campaign.  I thought I might find out who exactly they are.  I'm sure glad I did some more research because I discovered a tangled mess of organizations involved.

My original assertion was that this organization was a part of the Wild Earth Guardians Power Past Coal campaign.   I mean really, they have the same name!

Looking further into the WEG website I see that they (WEG) " heartily endorse and are a part of 350.org, a broad-based coalition to bring carbon dioxide down to safe levels".  Not sure who 350.org is but they just happen to be listed first on the list of organizations making up PowerPastCoal.org.

So I went ahead and looked up who the website (powerpastcoal.org) is registered to.  Lo and behold it's registered to someone in New Hampshire with a 350.org email address.  Very curious since their website claims that they are an organization that "acts locally". 

350.org  keeps who they really are private by using "Moniker Privacy Services" as as their registrant name.  Hmmmmm?  Why the secrecy?
Picture
Continue reading...   

The gist of the story is that we have a large number of "non profit" organizations contributing money to influence our local elections anonymously, and it isn't easy to track. In fact, it's very confusing. Most people wouldn't bother. Thanks to WhatcomWatchdog for even attempting it.

0 Comments

The 2013 IPCC Report: Facts vs. Fiction

10/18/2013

0 Comments

 
By Don J. Easterbrook, Ph.D.

Mark Twain popularized the saying: “There are lies, damned lies, and statistics.” After reading the recently released IPCC report, we can now add, “There are liars, damn liars, and IPCC.” When compared to the also [recently published 1000+-page volume of data on climate change [http://climatechangereconsidered.org/]] with thousands of peer-reviewed references, by the Nongovernmental International Panel on Climate Change (NIPCC), the inescapable conclusion is that the IPCC report must be considered the grossest misrepresentation of data ever published.

As MIT climate scientist Dr. Richard Lindzen stated, “The latest IPCC report has truly sunk to the level of hilarious incoherence—it is quite amazing to see the contortions the IPCC has to go through in order to keep the international climate agenda going.”

From the IPCC 2013 Report:
Picture
After all these years, IPCC still doesn’t get it—we’ve been thawing out from the Little Ice Age for several hundred years but still are not yet back to pre-Little Ice Age temperatures that prevailed for 90% of the past 10,000 years. Warming and cooling has been going on for millions of years, long before human-caused CO2 could have had anything to do with it, so warming in itself certainly doesn’t prove that it was caused by CO2.

The IPCC’s misrepresentation of data is blatantly ridiculous. In Fig. 1, the IPCC report purports to show warming of 0.5°C (0.9°F) since 1980, yet surface temperature measurements indicate no warming over the past 17 years (Fig. 2) and satellite temperature data shows the August 13 temperature only 0.12°C (0.21°F) above the 1980 temperature (Spencer, 2013). IPCC shows a decadal warming of 0.6°C (1°F) since 1980, but the temperature over the past decade has actually cooled, not warmed.
Picture
Fig 1. IPCC graph of temperatures.
Picture
Fig. 2. Measured surface temperatures for the past decade (modified from Monckton, 2013)
From the IPCC Report:
Picture
There just isn’t any nice way to say this: that is an outright lie. A vast published literature exists showing that recent warming is not only not unusual, but more intense warming has occurred many times in the past centuries and millennia. As a reviewer of the IPCC report, I called this to their attention, so they cannot have been unaware of it. For example, more than 20 periods of warming in the past five centuries can be found in the Greenland GISP2 ice core (Fig. 3) (Easterbrook, 2011), the Medieval and Roman Warm Periods were warmer than recent warming (Fig. 4), and about 90% of the past 10,000 years were warmer than the present (Fig. 5).
Picture
Figure. 3. More than 20 periods of warming in the past 500 years (Greenland GISP2 ice core, Easterbrook, 2011)
Picture
Figure 4. Temperatures of the Medieval and Roman Warm Periods were higher than recent temperatures.
Picture
Figure 5. ~90% of temperatures during the past 10,000 years were significantly warmer than recent warming (Cuffy and Clow, 1997; Alley, 2000).
Not only was recent warming not unusual, there have been at least three periods of warming or cooling in the past 15,000 years that have been 20 times more intense, and at least 15 have been five times as intense (Easterbrook, 2011).
Picture
Figure 6. Intensity of warming and cooling in the past 15,000 years (Easterbrook, 2011)
From the 2013 IPCC Report:
Picture
As shown by the figures above from peer-reviewed, published literature, this statement is false. No one disputes that the climate has warmed since the Little Ice Age of approximately 1300-1915 AD—we are still thawing out from it. Virtually all of this warming occurred long before CO2 could possibly be a causal factor.

From the 2013 IPCC Report:
Picture
This is a gross misrepresentation of data. The Antarctic ice sheet has not been losing mass—the East Antarctic ice sheet, which contains about 90% of the world’s fresh water, is not melting—it’s growing! The same is true for Antarctic shelf ice. The only part of Antarctica that may be losing ice is the West Antarctic Peninsula, which contains less than 10% of the Antarctic ice. Temperature records at the South Pole show no warming since records began in 1957.

Some melting occurred in Greenland during the 1978-1998 warming, but that is not at all unusual. Temperatures in Greenland were warmer in the 1930s than during the recent warming, and Greenland seems to be following global warming and cooling periods.

Arctic sea ice declined during the 1978-1998 warm period, but it has waxed and waned in this way with every period of warming and cooling, so that is not in any way unusual. Arctic sea ice expanded by 60% in 2013. Antarctic sea ice has increased by about 1 million km2 (but IPCC makes no mention of this!). The total extent of global sea ice has not diminished in recent decades.

The statement that Northern Hemisphere snow cover has “continued to decrease in extent” is false (despite the IPCC claim of ‘high confidence’). Winter snow extent in the Northern Hemisphere shows no decline since 1967, and five of the six snowiest winters have occurred since 2003 (Fig. 7).
Picture
Figure 7. Snow extent in the Northern Hemisphere since 1967.
The IPCC used only spring snow, which includes March-April, while winter snow cover includes November-April. The IPCC used the spring snow cover data to contend that because of CO2-caused global warming, less snow is occurring on Earth.

The amount of snow cover at any time is always a contest between the amount of snow and rate of melting. Thus, winter snow cover is likely to be most affected by the amount of snow. Not many areas at low elevations get a lot of snow in March and April, so the spring snow cover is likely to be most affected by the rate of snow melt. (Yes, it does snow in March/April and it does melt in Nov-April, but, overall, the dominant processes controlling snow cover are somewhat different). We have all seen bitter winters with large snowfall followed by a warm spring—you can’t really judge how snowy the winter was by how much snow remains at the end of spring. The question is, if you want to judge whether or not snow is disappearing from the Earth, which would you choose, spring snow cover or winter snow cover? The IPCC looked only at the spring snow cover over a two month period and totally ignored the winter snow cover over its six month period. The spring snow cover is more a reflection of how warm the spring was whereas the winter snow cover is likely a better measure of how snowy the winter was. Keeping in mind that the question is whether or not snow is going to be a thing of the past (as contended by some CO2 advocates), including the winter snow cover is critical.

And you can’t fail to take into account that during the past 100+ years we have had two periods of global warming (~1915 to ~1945 and 1978-1998) and two periods of global cooling (~1890 to ~1915 and ~1945-1977), so we shouldn’t be surprised to see trends change with time. We only have satellite coverage for the past 3-4 decades, which happens to coincide with the most recent warm period so we shouldn’t be surprised to see a declining snow cover trend during that period. But what about the preceding cool period (1945-1977) and the warm period from 1915 to 1945? How reliable is the snow cover data from 1920 to 1980? Probably not anywhere near as good as during the satellite era.

The point here is that by using only the spring snow cover to contend that snow is declining does not tell the whole story.

From the 2013 IPCC Report:
Picture
Sea level rise over the past century has varied from 1 to 3 mm/yr, averaging 1.7 mm/yr from 1900-2000 (Fig.8.) Sea level rose at a fairly constant rate from 1993 to about 2005, but the rate of rise flattened out until 2009 (Fig. 9). What is obvious from these curves is that sea level is continuing to rise at a rate of about 7 inches per century, and there is no evidence of accelerating sea level rise. Nor is there any basis for blaming it on CO2, because sea level has been rising for 150 years, long before CO2 levels began to increase after 1945.
Picture
Figure 8. Past sea level rise.
Picture
Figure 9. Sea level rise, 1993-2013. Note the flattening of the curve between 2005 and 2009 and the drop in sea level in 2011-2012. (U. of Colorado)
These are only a few examples of the highly biased misrepresentations of material in the 2013 IPCC report. As seen by the examples above, it isn’t science at all—it’s dogmatic political propaganda.

Don J. Easterbrook is professor of geology at Western Washington University.
0 Comments

Riot at WWU - Outrageous behavior, young voters

10/14/2013

2 Comments

 
There was national coverage of the absolutely outrageous and violent behavior that a mob near Western Washington University engaged in Saturday night. It is not known how many of these rioters are students at Western. The few people who were arrested were reportedly not students. The question remains, where did the nearly 500 rioters come from, exactly?

WE do know that in and around Western, these hundreds of people vote, and that they are constantly courted by environmental PACs and Whatcom Wins!

These little darlings did a nice number on the environment right there. Do they have any idea how big the carbon footprint is for all that beer? And whatever they belch out after drinking it? Not to mention the mess they made of the neighborhood: tearing down stop signs, pointless vandalism, littering ... everywhere. Way to nurture nature! Yelling “Faggot!”  Oh yes, that's a nice tolerant attitude toward homosexuals. All hail diversity! These are the people that Bellingham wants to protect from dangerously negligent landlords. WE wonder who really needs the protection. Al Gore should come down from Mt. Olympus and give them all a very good spanking.
2 Comments

Want to Save the Planet? Think For Yourselves, Crusaders

9/28/2013

13 Comments

 
Picture
    This little piece of work was handed out illiberally to students up at Western Washington University last week. It's a pledge card that suggests that four local candidates are in the can on a major issue that hasn't been through the complete review process.  And ho-yeah, it says vote for this foursome if you WANT TO SAVE THE PLANET.

These people (at least two of the four, who are already serving/incumbents) have a legal and moral duty to be fair-handed when the time comes to decide the GPT (Gateway Pacific Terminal) thing. This advertising promises they'll do something else.

WE won't tell you who to vote for, but if other candidates are saying  they'll vote "for" GPT, that would be just as bad.  Our position is that voting for pre-judged outcomes on anything is bad news.

WE'd just as soon see people skip voting altogether if they want our local self-government to be reduced to "winners take the spoils".  If that's the world you want, a government where candidates pre-judge issues, we'd rather see you have a nice meal, take a bike ride, get stoned, and save the stamp.

Whatcom WINS telling people to follow blindly is despicable. This promotion pushes every pretense of ethics over the cliff. Is that what "being a Democrat" has become? (Whatcom WINS is the Whatcom Democrats marketing strategy, or battle cry, this year).

What's heroic about elected officials making up their minds in advance?

That's downright indefensible, not only technically but morally unethical. Voting for pre-judgement if it suits your taste splits the community and pushes it down a dangerous and slippery slope.

This promotion also lays out a guilt trip. What's it saying - if you don't vote for these four, you're voting to trash the planet?  Apparently.

Does anybody actually believe that the "future of the global climate" is resting on the shoulders of this county, on this election (and its voters)?  That's a wild claim. People are cashing in on drama here - emotional theater. Use your head and keep this in proportion.

Picture
Clockwise from left: SuperMann (Ken Mann), Blazing Barry (Buchanan), Rud-Urban (Browne), Captain Save-The-Planet (Carl Weimer)
Picture...for these guys, "in the tank" ?
This pledge card - let there be no doubt that it says (wink-wink) that electing these candidates will trashcan the Gateway Pacific Terminal proposal.  The fudgy-wudgy phrasing about "how America uses its coal" doesn't fool anybody. This relays "vote this way, get your way" as a guarantee.  That's a stone's throw from "winners take the spoils." Is that your idea of good (self) government?

That's pretty insulting when you stop and think about it. The people we elect aren't supposed to pre-judge things.  If they got elected, they should recuse themselves (as if they would). Campaign promises are rarely worth the paper they're printed on. 

Now, some people are so fanatical they think that "the ends justify the means" and pre-judging is okay in this case. Whaa???  Are these candidates saying "Who needs the Corps of Engineers and the EPA?"  Would they ignore any law or regulation that suits them?

It comes down to trust and integrity. Do you want honesty and fairness, or just one result?  Can you trust anybody who would act like that? These people take an oath to be objective; to uphold and defend the rule of law, instead of popular fads. 

WE could go on, but why not let George Carlin close for us, in his own inimitable way? (Caution, strong language!)

13 Comments

Press Primed To Lie About Climate Change

9/17/2013

2 Comments

 
Picture
        Everyone who lives in Whatcom County (left or right) knows the truth about how blatantly partial the press is in these parts. This situation has existed for so long that even the guys on the beat don't begin to pretend that they don't "lean left." Despite the local facts of life, WE had no idea how truly insidious coaching to lie has become where it comes to climate change. Check this out:


Picture
"CLIMATE CHANGE FOR JOURNALISTS" OFFERS A PRIMER IN LYING TO YOUR READERS, Sept 16 2013
Jeff Rhodes, Electronic News Editor - Libertyville.org
Email


Picture
Those who believe, as I do, that the mainstream media overwhelmingly tilt to the left usually concede this bias is more institutional than conspiratorial in nature. 

Journalists don’t normally sit in meetings and plot ways to tell only one side of the story; they simply write from their own personal perspective — which tends to be almost exclusively liberal. Usually very liberal.

There are, however, exceptions to this rule as I discovered last week when I attended a two-day “Climate Change for Journalists” workshop hosted by the Seattle Times. Held at the Bullitt Center, which bills itself as the “world’s greenest building,” and conducted by the University of Rhode Island’s Metcalf Institute for Marine and Environmental Reporting, the event was precisely what we’re told never happens: a conscious, deliberate effort to coach reporters on the finer points of deceiving their readers and viewers into believing climate change is settled science.

Not that the assembled “journalists” needed a lot of arm-twisting. Reading though the bios of those who, like me, wangled invitations to the workshop, I noticed a participant who attended “on behalf of people who grow and raise our food, not all of whom accept that climate change is real.” Another proudly noted his “major area of interest is how the rhetoric and science of climate change, biodiversity loss and human health inform the creation of public policy.”

Four attendees were Seattle Times staffers, not including Kathy Best, the publication’s managing editor, who proudly introduced the event’s speakers.

I didn’t ask for a show of hands, but I’d be willing to wager I was the only climate change agnostic among the journalists present. As for the presenters…forget about it.

The first session of the day, for example, promised attendees “…a strong scientific and policy foundation for journalists covering the broad implications of climate change, just in time for the next highly anticipated report of the Intergovernmental Panel on Climate Change (IPCC).” For the record, not once in the discussion did anyone bother to point out that, in the IPCC’s previous report, it was caught redhanded falsifying its findings to look like man-made CO2 emissions were causing global warming, even though scientific evidence showed nothing of the kind.

This was followed, even more disturbingly, by a session with Hedia Adelsman, representing the Washington State Department of Ecology, who cheerily informed her audience that, “If there’s one thing we know for certain, it’s that human activities are changing the climate in ways that have committed us to centuries of change in temperature, preciptation, sea level rise and change in ocean chemistry, posing risks to our environment, econmony and way of life.”

And so it went with one speaker after another reassuring those who already agreed with them that there was only one viewpoint worth considering.

In point of fact, if there’s one thing we know for certain, it’s that nothing in science is ever certain. For every true believer the Metcalf Institute can trot out claiming the question of global warming is settled, I can counter with an equally distinguished skeptic. That isn’t to say either side is right. Clearly there are differing views on the subject and, despite what zealots in government and academia would have you believe, nothing close to a consensus exists on either side. 

And as a journalist, I’m fine with presenting both sides of the issue. What I’m not fine with is obvious collusion to ignore facts that don’t comport with preconceived environmental and political biases. It's not fair to the issues and, more importantly, it's not fair to the American people.

2 Comments
<<Previous
Forward>>
    WE Dredge!
    Picture
    Posting Rules:
    This forum is moderated.  Please make an effort to substantiate claims that support opinion.  Gratuitous profanity and ad-hominem attacks will not be accepted.  You can create a "nickname" if you'd like, and you don't have to reveal your e-mail address.   Feel free to share information and your honest thoughts.

    Categories

    All
    Agenda 21
    Best Available Science
    Big Government
    Eco Activism
    Ethics
    Freedom
    Planning
    Property Rights
    Science
    Small Business
    Social Engineering
    Taxes
    Welcome

    Archives

    January 2022
    September 2020
    August 2020
    April 2020
    November 2019
    August 2019
    September 2018
    July 2018
    May 2018
    April 2018
    January 2018
    December 2017
    September 2017
    July 2017
    April 2017
    March 2017
    February 2017
    January 2017
    December 2016
    November 2016
    October 2016
    September 2016
    August 2016
    July 2016
    June 2016
    May 2016
    April 2016
    March 2016
    February 2016
    January 2016
    December 2015
    November 2015
    October 2015
    September 2015
    August 2015
    June 2015
    March 2015
    January 2015
    December 2014
    November 2014
    September 2014
    August 2014
    July 2014
    June 2014
    May 2014
    April 2014
    March 2014
    February 2014
    January 2014
    December 2013
    November 2013
    October 2013
    September 2013
    August 2013
    July 2013
    June 2013
    May 2013
    April 2013
    March 2013
    February 2013
    January 2013
    December 2012
    November 2012
    October 2012
    September 2012
    August 2012
    July 2012
    June 2012
    May 2012
    April 2012
    March 2012
    February 2012
    January 2012
    December 2011
    November 2011
    October 2011
    September 2011
    August 2011
    July 2011
    June 2011


    Automatic Updates

    Do you want to be notified when new content is added to this newsfeed? Most browsers allow you to subscribe to our Really Simple Syndication (RSS) feed. Click on the RSS link below, and follow the instructions.

    RSS Feed

Powered by Create your own unique website with customizable templates.