By Don J. Easterbrook, Ph.D.
Mark Twain popularized the saying: “There are lies, damned lies, and statistics.” After reading the recently released IPCC report, we can now add, “There are liars, damn liars, and IPCC.” When compared to the also [recently published 1000+-page volume of data on climate change [http://climatechangereconsidered.org/]] with thousands of peer-reviewed references, by the Nongovernmental International Panel on Climate Change (NIPCC), the inescapable conclusion is that the IPCC report must be considered the grossest misrepresentation of data ever published.
As MIT climate scientist Dr. Richard Lindzen stated, “The latest IPCC report has truly sunk to the level of hilarious incoherence—it is quite amazing to see the contortions the IPCC has to go through in order to keep the international climate agenda going.”
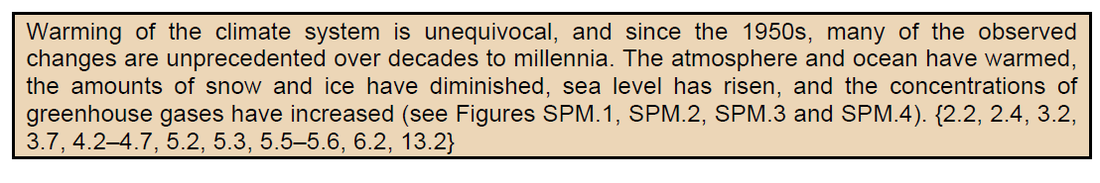
From the IPCC 2013 Report:
Mark Twain popularized the saying: “There are lies, damned lies, and statistics.” After reading the recently released IPCC report, we can now add, “There are liars, damn liars, and IPCC.” When compared to the also [recently published 1000+-page volume of data on climate change [http://climatechangereconsidered.org/]] with thousands of peer-reviewed references, by the Nongovernmental International Panel on Climate Change (NIPCC), the inescapable conclusion is that the IPCC report must be considered the grossest misrepresentation of data ever published.
As MIT climate scientist Dr. Richard Lindzen stated, “The latest IPCC report has truly sunk to the level of hilarious incoherence—it is quite amazing to see the contortions the IPCC has to go through in order to keep the international climate agenda going.”
From the IPCC 2013 Report:
After all these years, IPCC still doesn’t get it—we’ve been thawing out from the Little Ice Age for several hundred years but still are not yet back to pre-Little Ice Age temperatures that prevailed for 90% of the past 10,000 years. Warming and cooling has been going on for millions of years, long before human-caused CO2 could have had anything to do with it, so warming in itself certainly doesn’t prove that it was caused by CO2.
The IPCC’s misrepresentation of data is blatantly ridiculous. In Fig. 1, the IPCC report purports to show warming of 0.5°C (0.9°F) since 1980, yet surface temperature measurements indicate no warming over the past 17 years (Fig. 2) and satellite temperature data shows the August 13 temperature only 0.12°C (0.21°F) above the 1980 temperature (Spencer, 2013). IPCC shows a decadal warming of 0.6°C (1°F) since 1980, but the temperature over the past decade has actually cooled, not warmed.
The IPCC’s misrepresentation of data is blatantly ridiculous. In Fig. 1, the IPCC report purports to show warming of 0.5°C (0.9°F) since 1980, yet surface temperature measurements indicate no warming over the past 17 years (Fig. 2) and satellite temperature data shows the August 13 temperature only 0.12°C (0.21°F) above the 1980 temperature (Spencer, 2013). IPCC shows a decadal warming of 0.6°C (1°F) since 1980, but the temperature over the past decade has actually cooled, not warmed.
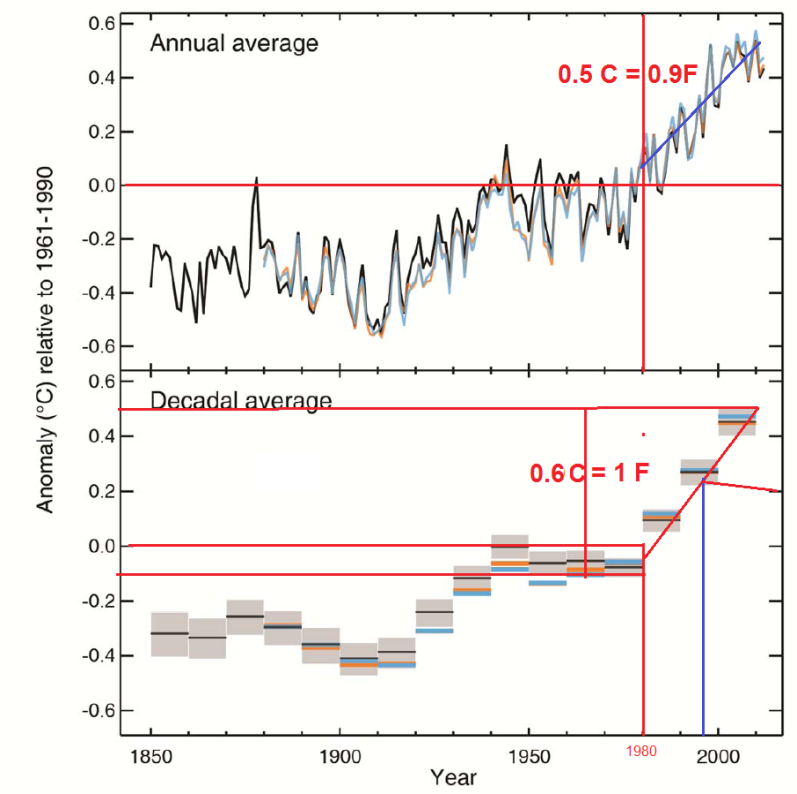
Fig 1. IPCC graph of temperatures.
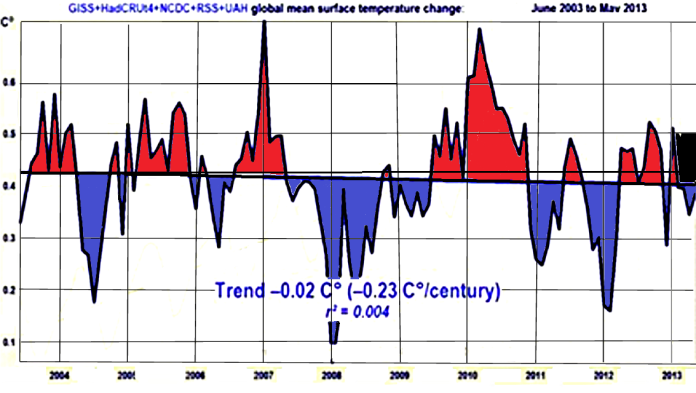
Fig. 2. Measured surface temperatures for the past decade (modified from Monckton, 2013)
From the IPCC Report:

There just isn’t any nice way to say this: that is an outright lie. A vast published literature exists showing that recent warming is not only not unusual, but more intense warming has occurred many times in the past centuries and millennia. As a reviewer of the IPCC report, I called this to their attention, so they cannot have been unaware of it. For example, more than 20 periods of warming in the past five centuries can be found in the Greenland GISP2 ice core (Fig. 3) (Easterbrook, 2011), the Medieval and Roman Warm Periods were warmer than recent warming (Fig. 4), and about 90% of the past 10,000 years were warmer than the present (Fig. 5).
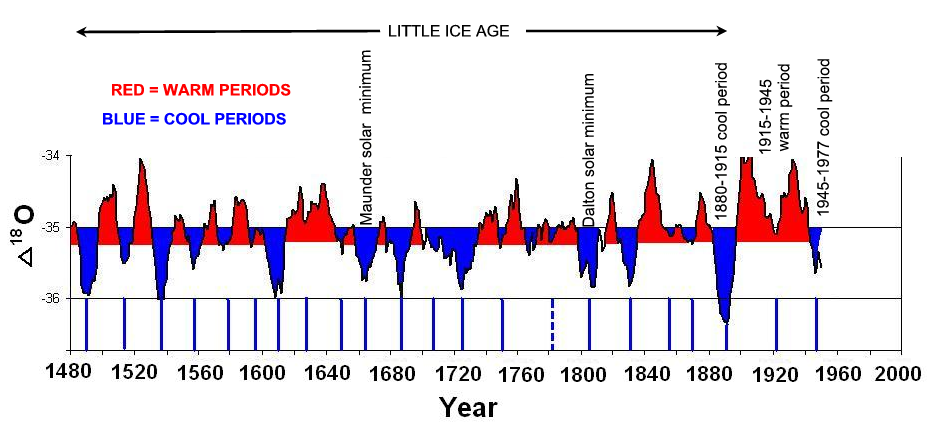
Figure. 3. More than 20 periods of warming in the past 500 years (Greenland GISP2 ice core, Easterbrook, 2011)
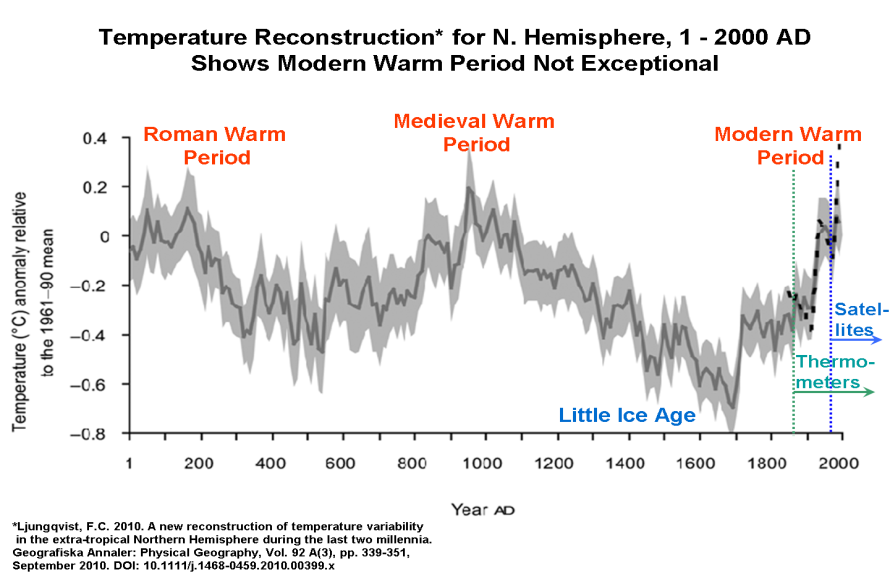
Figure 4. Temperatures of the Medieval and Roman Warm Periods were higher than recent temperatures.
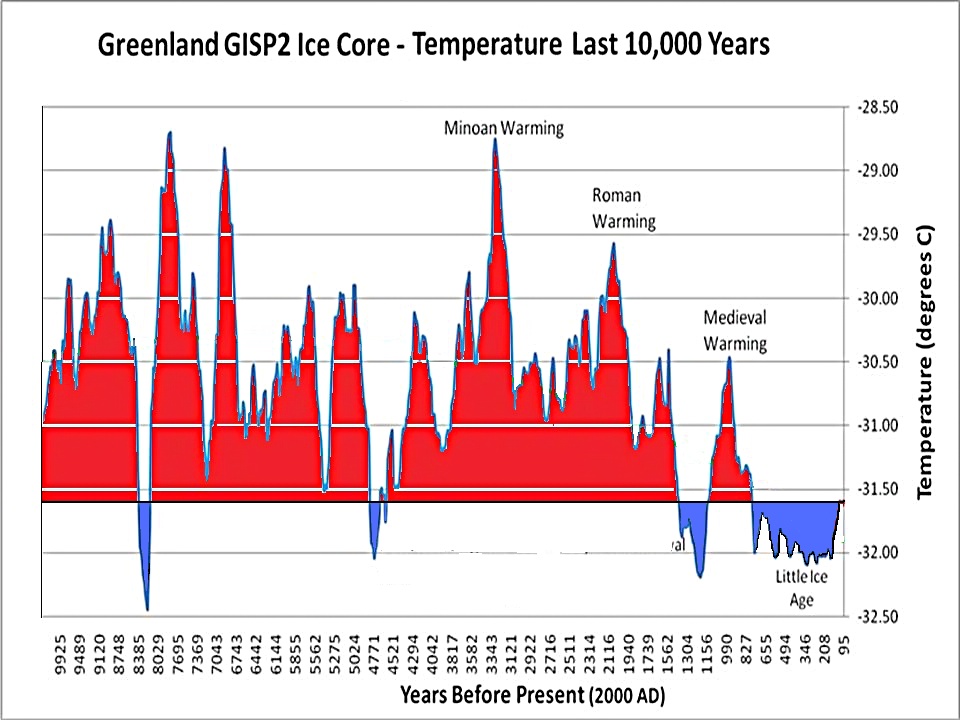
Figure 5. ~90% of temperatures during the past 10,000 years were significantly warmer than recent warming (Cuffy and Clow, 1997; Alley, 2000).
Not only was recent warming not unusual, there have been at least three periods of warming or cooling in the past 15,000 years that have been 20 times more intense, and at least 15 have been five times as intense (Easterbrook, 2011).
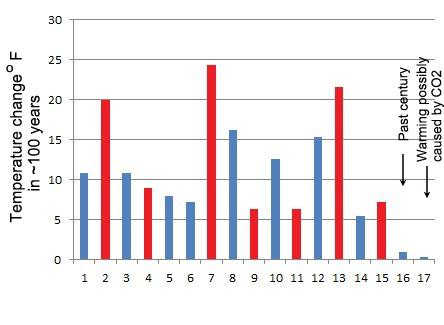
Figure 6. Intensity of warming and cooling in the past 15,000 years (Easterbrook, 2011)
From the 2013 IPCC Report:
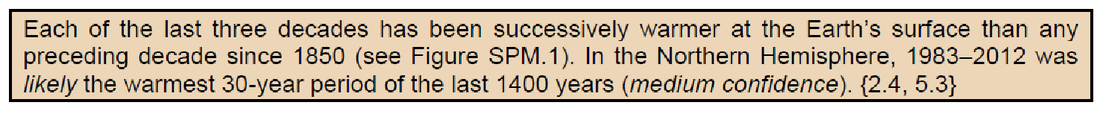
As shown by the figures above from peer-reviewed, published literature, this statement is false. No one disputes that the climate has warmed since the Little Ice Age of approximately 1300-1915 AD—we are still thawing out from it. Virtually all of this warming occurred long before CO2 could possibly be a causal factor.
From the 2013 IPCC Report:
From the 2013 IPCC Report:
This is a gross misrepresentation of data. The Antarctic ice sheet has not been losing mass—the East Antarctic ice sheet, which contains about 90% of the world’s fresh water, is not melting—it’s growing! The same is true for Antarctic shelf ice. The only part of Antarctica that may be losing ice is the West Antarctic Peninsula, which contains less than 10% of the Antarctic ice. Temperature records at the South Pole show no warming since records began in 1957.
Some melting occurred in Greenland during the 1978-1998 warming, but that is not at all unusual. Temperatures in Greenland were warmer in the 1930s than during the recent warming, and Greenland seems to be following global warming and cooling periods.
Arctic sea ice declined during the 1978-1998 warm period, but it has waxed and waned in this way with every period of warming and cooling, so that is not in any way unusual. Arctic sea ice expanded by 60% in 2013. Antarctic sea ice has increased by about 1 million km2 (but IPCC makes no mention of this!). The total extent of global sea ice has not diminished in recent decades.
The statement that Northern Hemisphere snow cover has “continued to decrease in extent” is false (despite the IPCC claim of ‘high confidence’). Winter snow extent in the Northern Hemisphere shows no decline since 1967, and five of the six snowiest winters have occurred since 2003 (Fig. 7).
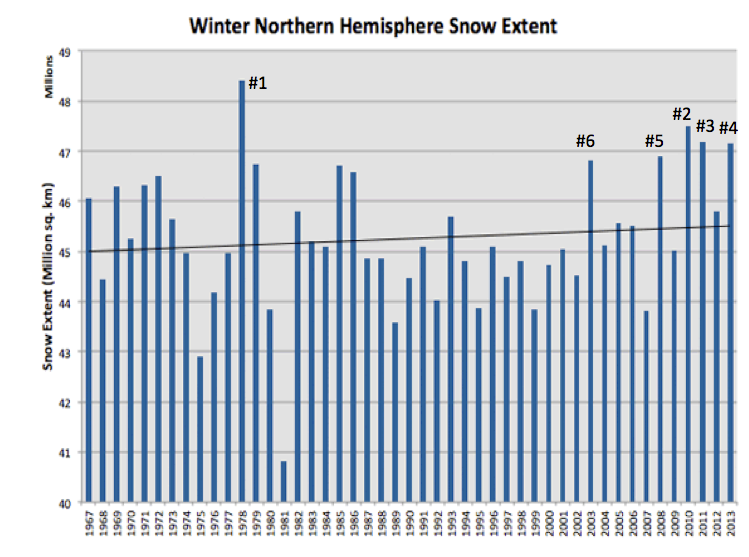
Figure 7. Snow extent in the Northern Hemisphere since 1967.
The IPCC used only spring snow, which includes March-April, while winter snow cover includes November-April. The IPCC used the spring snow cover data to contend that because of CO2-caused global warming, less snow is occurring on Earth.
The amount of snow cover at any time is always a contest between the amount of snow and rate of melting. Thus, winter snow cover is likely to be most affected by the amount of snow. Not many areas at low elevations get a lot of snow in March and April, so the spring snow cover is likely to be most affected by the rate of snow melt. (Yes, it does snow in March/April and it does melt in Nov-April, but, overall, the dominant processes controlling snow cover are somewhat different). We have all seen bitter winters with large snowfall followed by a warm spring—you can’t really judge how snowy the winter was by how much snow remains at the end of spring. The question is, if you want to judge whether or not snow is disappearing from the Earth, which would you choose, spring snow cover or winter snow cover? The IPCC looked only at the spring snow cover over a two month period and totally ignored the winter snow cover over its six month period. The spring snow cover is more a reflection of how warm the spring was whereas the winter snow cover is likely a better measure of how snowy the winter was. Keeping in mind that the question is whether or not snow is going to be a thing of the past (as contended by some CO2 advocates), including the winter snow cover is critical.
And you can’t fail to take into account that during the past 100+ years we have had two periods of global warming (~1915 to ~1945 and 1978-1998) and two periods of global cooling (~1890 to ~1915 and ~1945-1977), so we shouldn’t be surprised to see trends change with time. We only have satellite coverage for the past 3-4 decades, which happens to coincide with the most recent warm period so we shouldn’t be surprised to see a declining snow cover trend during that period. But what about the preceding cool period (1945-1977) and the warm period from 1915 to 1945? How reliable is the snow cover data from 1920 to 1980? Probably not anywhere near as good as during the satellite era.
The point here is that by using only the spring snow cover to contend that snow is declining does not tell the whole story.
From the 2013 IPCC Report:
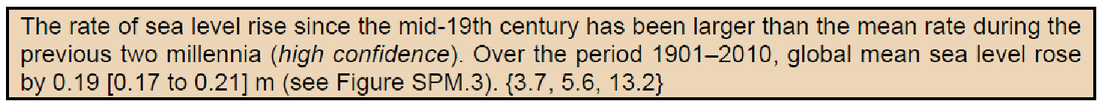
Sea level rise over the past century has varied from 1 to 3 mm/yr, averaging 1.7 mm/yr from 1900-2000 (Fig.8.) Sea level rose at a fairly constant rate from 1993 to about 2005, but the rate of rise flattened out until 2009 (Fig. 9). What is obvious from these curves is that sea level is continuing to rise at a rate of about 7 inches per century, and there is no evidence of accelerating sea level rise. Nor is there any basis for blaming it on CO2, because sea level has been rising for 150 years, long before CO2 levels began to increase after 1945.
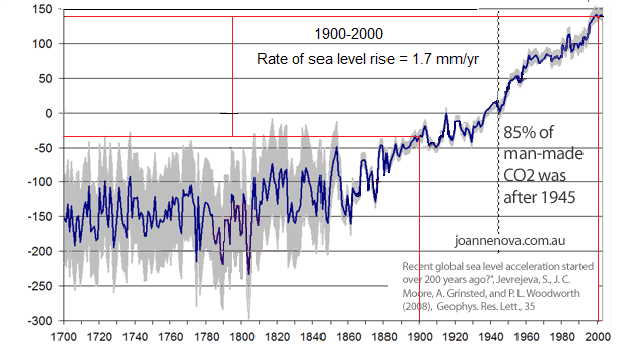
Figure 8. Past sea level rise.
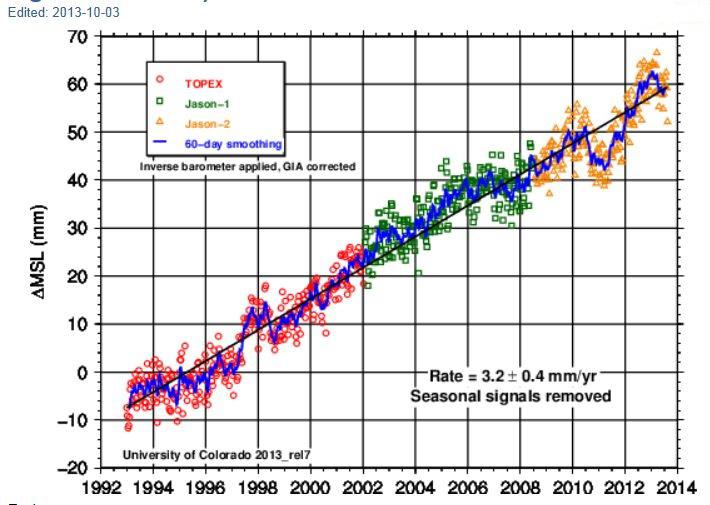
Figure 9. Sea level rise, 1993-2013. Note the flattening of the curve between 2005 and 2009 and the drop in sea level in 2011-2012. (U. of Colorado)
These are only a few examples of the highly biased misrepresentations of material in the 2013 IPCC report. As seen by the examples above, it isn’t science at all—it’s dogmatic political propaganda.
Don J. Easterbrook is professor of geology at Western Washington University.
Don J. Easterbrook is professor of geology at Western Washington University.

 RSS Feed
