The Whatcom Excavator
  • Home
    • About Us
    • Who's Planning Our Lives?
    • Diminishing Property Rights
    • NGO's & Public-Private Partners
    • Agenda 21
    • Buzzwords
    • Deep Thought
    • Best Available Science
    • Best Available Humor >
      • Humor Archive
  • The DREDGE
    • Gotta See This
    • How To Dredge
  • Bulldozed
    • Eco-Activism and County Policy
    • CELDF - "Democracy"
    • ALERT: Community Energy Challenge
  • Pig Trough
    • ReSources
    • Sustainable Connections
    • BALLE
    • ICLEI
    • Whatcom County Community Network
    • Big Wheels Award
  • Contact Us

The Herald Makes it Dead Simple!

10/29/2013

9 Comments

 
Picture
Over the weekend, the Bellingham Herald endorsed Rud Browne, Barry Buchanan, Ken Mann and Carl Weimer, saying (and WE quote) "[Kershner, Elenbaas, Knutzen and Luke] want government to "get out of the way" at a time when more is required."  (Emphasis ours.)

The Bellingham Herald has unwittingly made voters' choice dead simple.

If you want your life here to be governed more, vote for Browne, Buchanan, Mann and Weimer.

If you want this area's government to have tangible limits, vote for Kershner, Elenbaas, Knutzen and Luke.

The rhetorical goal was, as always, the mobilization of partisan bias:  to identify restraint as outside the mainstream.

Allow us to share one basic principle about government:  Up to a certain point, government services actually do provide more freedom and self-determination when they're carefully contained. Government work that serves essential needs more efficiently than we could meet them alone allows us to attend to our own endeavors without being unduly or unjustly burdened. But beyond that point, government crosses the line to burdensome and oppressive governance. Instead of leaving us free to mind our own business, government starts sticking its nose into our business. WE believe government crossed into the realm of oppressive governance a long time ago.

There have always been loopy blue laws, but WE thought the nation got past most some time ago. Alas, the lust to rule seems like a hiccup in human nature.  Take a trip to the Nanny State and explore how easily good intentions slip to petty tyranny, and "nudge" becomes "shove."  The appetites of some to govern is a wonder to behold.

If personal and civil liberty mean little to you, and the thought of a ballooning local bureaucratic state seems safe - well, you know who to vote for.  The Herald told you so.

Could this problem be solved with more freedom, instead of less? ~ Penn Jillette

9 Comments

National Geographic Rising Sea Level Prophecy - Cause for Concern or Absurd Fairy Tale?

10/20/2013

1 Comment

 
By Don J. Easterbrook, Ph.D.

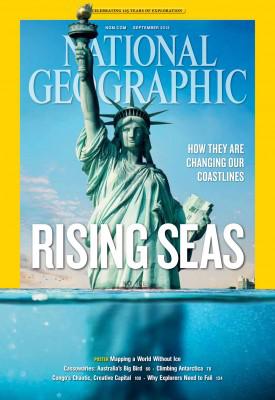
The September issue of National Geographic shows sea level midway up the Statue of Liberty, 214 feet above present sea level (Fig. 1) and contains dire images of impending catastrophic sea level rise. Anthony’s excellent responses (http://wattsupwiththat.com/?s=national+geographic) and
(http://wattsupwiththat.com/2010/11/28/freaking-out-about-nyc-sea-level-rise-is-easy-to-do-when-you-dont-pay-attention-to-history/) have demonstrated the utter absurdity of the National Geographic portrayal.   
Picture
Figure 1. Cover of October issue of National Geographic.
As Anthony points out, at the rate of sea level rise shown by tide gauge records since 1856 at The Battery 1.7 miles away, for sea level to reach that high up the Statue of Liberty would take 23,538 years!

But what about the other assertions in the National Geographic article, such as (1) many graphic images of what the future holds, (2) smaller, but still unreasonable sea level rise, (3) doomed cities (Miami and London gone), (4) flooded coastal areas (most of southern Florida submerged), (5) more frequent storm surge disasters due to sea level rise, and (6) various other catastrophic scenarios? Are any these cause for concern or are they also just unfounded, fear-mongering scenarios aimed at getting attention? Let’s look at some the contentions in the National Geographic scenarios.

  1. "By releasing carbon dioxide and other heat-trapping gases into the atmosphere, we have warmed the Earth by more than a full degree Fahrenheit over the past century and raised sea level by about eight inches. Even if we stopped burning all fossil fuels tomorrow, the existing greenhouse gases would continue to warm the Earth for centuries. We have irreversibly committed future generations to a hotter world and rising seas."
  2. "…the big concern for the future is the giant ice sheets in Greenland and Antarctica." "If the Thwaites Glacier breaks free from its rocky berth, that would liberate enough ice to raise sea level by three meters—nearly ten feet."
  3. "by the time we get to the end of the 21st century, we could see sea-level rise of as much as six feet globally instead of two to three feet. Last year an expert panel convened by the National Oceanic and Atmospheric Administration adopted 6.6 feet (two meters) as its highest of four scenarios for 2100. The U.S. Army Corps of Engineers recommends that planners consider a high scenario of five feet." "we’re already locked in to at least several feet of sea-level rise, and perhaps several dozens of feet"
  4. "Inexorably rising oceans will gradually inundate low-lying areas" "By the next century, if not sooner, large numbers of people will have to abandon coastal areas in Florida and other parts of the world." "With seas four feet higher than they are today—a distinct possibility by 2100—about two-thirds of southeastern Florida is inundated. The Florida Keys have almost vanished. Miami is an island."
  5. "A profoundly altered planet is what our fossil-fuel-driven civilization is creating, a planet where Sandy-scale flooding will become more common and more destructive for the world’s coastal cities." "…higher seas will extend the ruinous reach of storm surges. The threat will never go away; it will only worsen. By the end of the century a hundred-year storm surge like Sandy’s might occur every decade or less."
  6. "…carbon dioxide in the atmosphere will reach around a thousand parts per million by the end of the century," "According to the U.S. Geological Survey, sea level on an iceless Earth would be as much as 216 feet higher than it is today. It might take thousands of years and more than a thousand parts per million to create such a world—but if we burn all the fossil fuels, we will get there."
  7. "by 2070, 150 million people in the world’s large port cities will be at risk from coastal flooding, along with $35 trillion worth of property."

These 7 statements are not as obviously ridiculous as the depiction of a 216 foot sea level rise at the Statue of Liberty, but all carry ominous consequences if true. Are any of these contentions realistic? Let’s consider real-time scientific data for each of them.

 1.    Has carbon dioxide warmed the Earth by more 1º F over the past century?

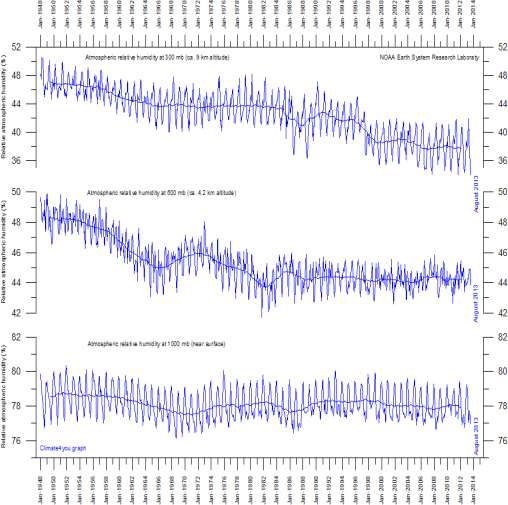
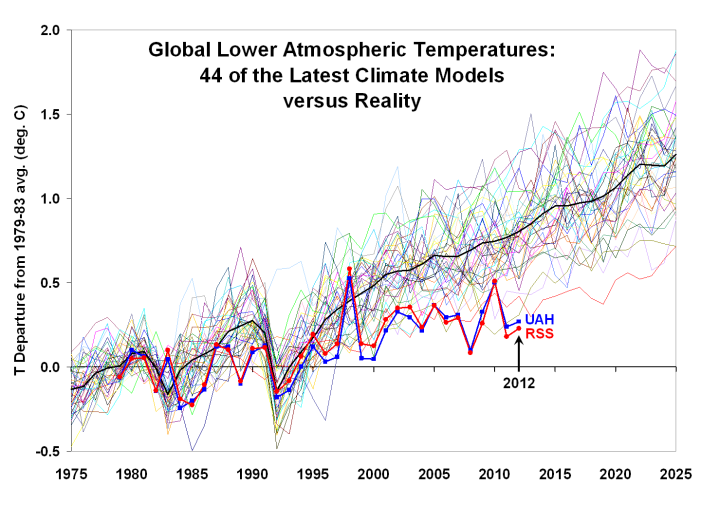
Carbon dioxide is a trace gas that makes up only 0.039% of the atmosphere, accounts for only 3.6% of the greenhouse effect, and has increased by only 0.009% since 1950. By itself, it is incapable of warming the climate by more than a fraction of a degree. With no physical evidence that CO2 causes significant atmospheric warming, the IPCC rely solely on computer models, but because the effect of CO2 is so small, they introduce an increase in water vapor (which is responsible for 95% of greenhouse warming), claiming that as CO2 goes up so does water vapor. For models to be valid, a real-world atmospheric water vapor must go up, but just the opposite is true—water vapor has gone down since 1947 (Fig. 2). Thus, climate models have been an utter failure (Fig. 3).
Picture
Figure 2. Declining atmospheric water vapor since 1947.
Picture
Figure 3. Failure of climate models to match reality. Dark line is average temperature predictions of 44 models; red and blue lines are actual temperatures.
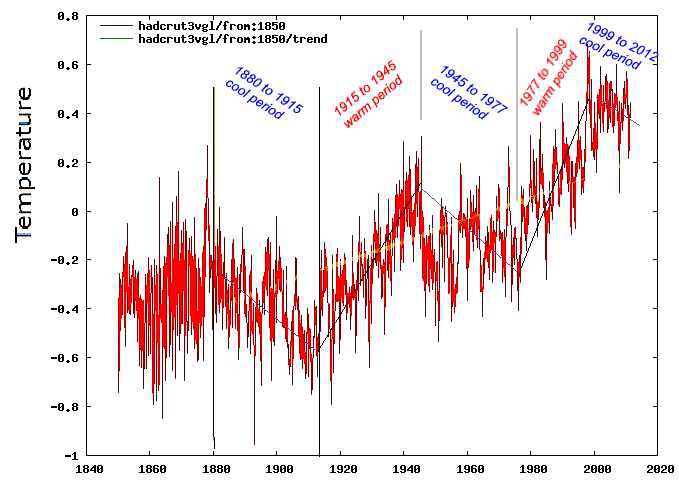
The National Geographic claims that CO2 has caused 1º F of warming this century. But CO2 didn’t begin to rise sharply until after 1945 so cannot have been a factor before then. Temperature data shows that 0.7° C of warming occurred from 1900 to 1945, before CO2 could have been the cause and while CO2 emissions soared from 1945 to 1977, global temperatures declined (just the opposite of what should have occurred if CO2 causes warming), and only 0.5°C warming from 1978 to present coincided with rising CO2 (and that is very likely coincidental). 
Picture
Figure. 4. Temperature changes during the past century.
Much additional data showing the CO2 is of little significance in global warming is summarized in the Nongovernmental International Panel on Climate Change 2013 report “Climate Change Reconsidered II: Physical Science.” This 1200 page report convincingly and systematically challenges IPCC claims that carbon dioxide is causing “dangerous” global warming and that IPCC computer models can be relied on for future climate forecasts.

Conclusions: National Geographic’s statement that CO2 caused 1º F of global warming this century is contrary to scientific evidence and is thus false.  

2.   “…the big concern for the future is the giant ice sheets in Greenland and Antarctica.” “If the Thwaites Glacier breaks free from its rocky berth, that would liberate enough ice to raise sea level by three meters—nearly ten feet.”

That this is not going to happen is shown by (1) there is no evidence that this has ever happened in the past and several factors insure that it won’t happen any time soon, (2) Antarctic glaciers are frozen to their base and move by internal flowage of ice, not by basal sliding, (3) these ice sheets lie in basins, and (4) the Greenland ice sheet is behaving just as it has in the geologic past and there is nothing unusual happening to it now. 

Conclusion: The likelihood of ice sheets in Greenland and Antarctic sliding into the sea is essentially zero.

3.  “by the time we get to the end of the 21st century, we could see sea-level rise of as much as six feet globally instead of two to three feet. Last year an expert panel convened by the National Oceanic and Atmospheric Administration (NOAA) adopted 6.6 feet (two meters) as its highest of four scenarios for 2100. The U.S. Army Corps of Engineers recommends that planners consider a high scenario of five feet.” “we’re already locked in to at least several feet of sea-level rise, and perhaps several dozens of feet.”

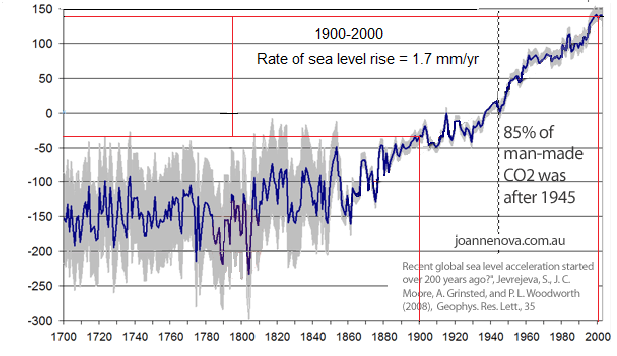
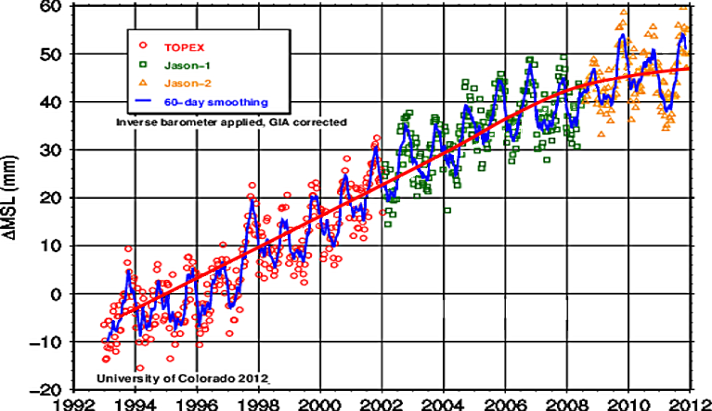
How realistic are these predictions of sea level rise of six feet to several dozens of feet? To answer that, all we have to do is look at the sea level rise for the past century and compare it with the National Geographic projection. Sea level has risen 7 inches in the past century at a relatively constant rate of 1.7 mm/yr from 1900 to 2000 (Fig. 5) and has actually shown signs of decline in the past few years (Fig. 6).
Picture
Figure 5. Sea level rise of 1.7 mm/yr from 1900 to 2000.
Picture
Figure 6. Sea level rise since 1993.
Picture
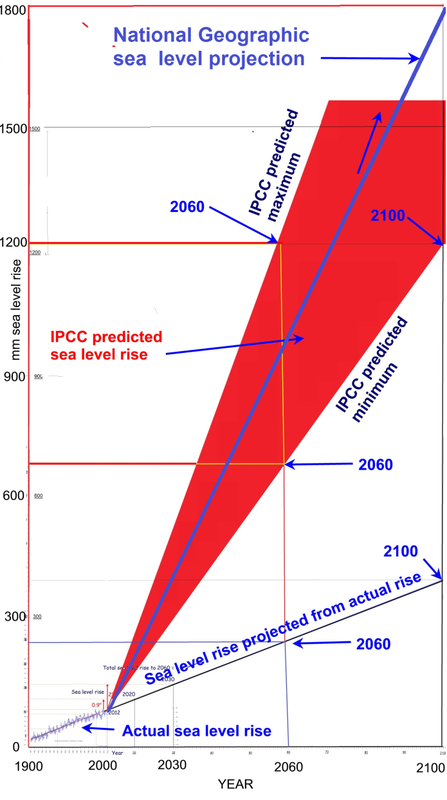
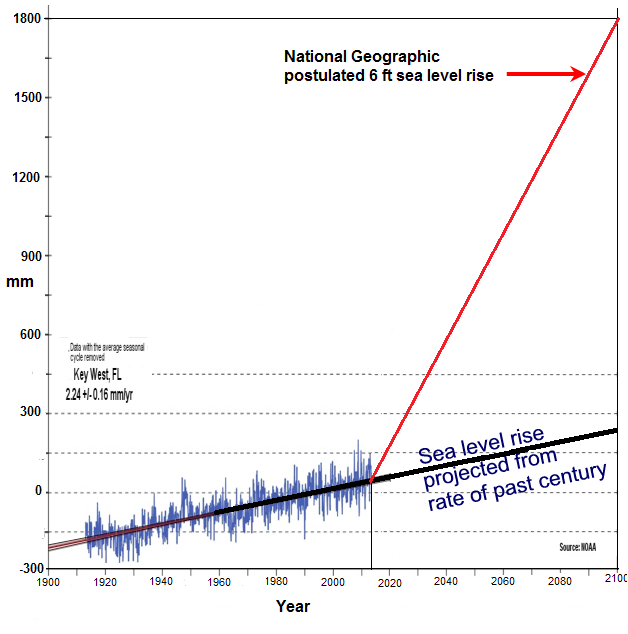
Figure 7. Sea level rise over the past century (lower left), sea level rise projected at this rate (black line, lower part of graph), and IPCC predicted sea level rise (red).
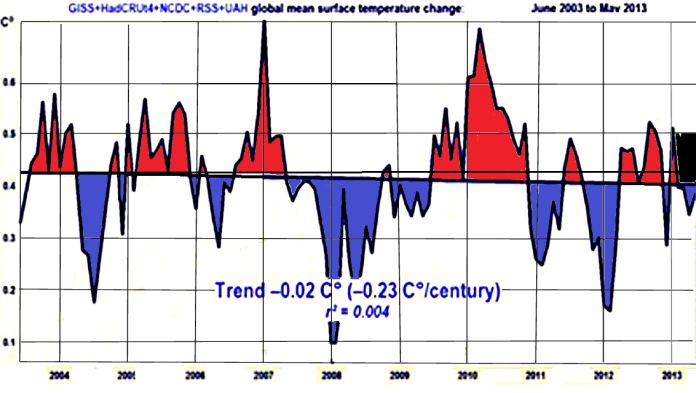
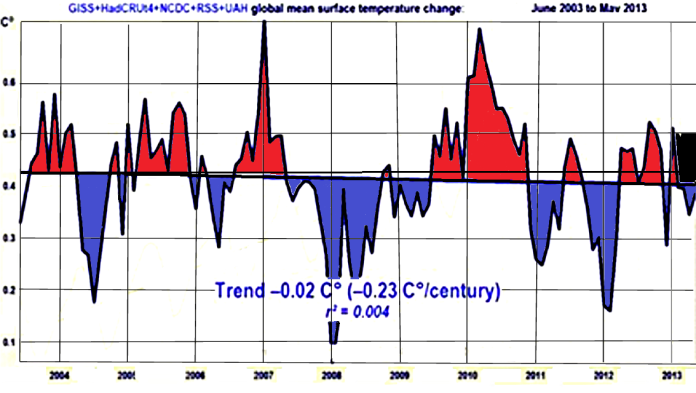
 The difference between the sea level rise projected from actual rise over the past century and the catastrophic scenario of the National Geographic is 15 times the rate of sea level rise over the past century! Two questions immediately arise: (1) what is going to cause such accelerated sea level rise and (2) where is all the water going to come from? The accelerated rise is based on postulated accelerated warming but there has been no warming in the past 15 years (in fact, the climate has cooled during that time (Figure 8). So no climatic warming means no accelerated sea level rise as postulated by the National Geographic .
Picture
Figure 8. Cooling of -0.23°C per century over the past decade. (modified from Monckton, 2013)
In order to get the accelerated sea level rise postulated by National Geographic, much of the Greenland and Antarctic ice sheets would have to melt. However the Antarctic ice cap is growing, not melting, and the Greenland ice cap was about the same size as at present during the Holocene Climatic Optimum. Morner (2011) has pointed out that, even during warming 20 times more intense than recent warming, melting of the massive Pleistocene ice sheets that covered vast areas resulted in sea level rise no greater than one meter per century. Thus, now that these great ice sheets are gone, there is no source of water for sea level rise even approaching one meter, so any prediction of sea level greater than that cannot be considered credible. The National Geographic scenario of the rate of sea level rise of six feet would require a rate of sea level rise of 20 mm/yr. in contrast to the rate of 1.7 mm over the past century. 

Conclusion: These data demonstrate that the scenario painted by the National Geographic of very large rise of sea level by 2100 is contrary to all physical scientific data and therefore its credibility must be totally rejected.

4.  “Inexorably rising oceans will gradually inundate low-lying areas” “By the next century, if not sooner, large numbers of people will have to abandon coastal areas in Florida and other parts of the world.” “With seas four feet higher than they are today—a distinct possibility by 2100—about two-thirds of southeastern Florida is inundated. The Florida Keys have almost vanished. Miami is an island.”

How credible is submergence of two thirds of Florida by 2100, leaving Miami as an island? Figure 9 shows that sea level rose 7 inches at a constant rate (2.24 mm/yr) during the past century at Key West (which is representative of southern Florida sea level rise). Projection of that rate to 2100 (Fig. 9) would result in a sea level rise of 6 inches by then. Contrast this with the National Geographic projected sea level rise of 21 mm/yr. What could possibly cause such a huge, sudden change in the rate of sea level rise? The answer is that it is not even close to being credible because (1) with no global warming in the past 17 years there is no reason for such a change, (2) there is no source of water--the East Antarctica ice sheet is not melting and Greenland has been warmer for thousands of years in the past without melting its ice sheet, (3) Antarctic sea ice is increasing, setting records, and (4) even during the rapid, intense melting of huge ice sheet at the end of the last Ice Age, sea level didn’t rise this fast. Continuation of sea level at the constant rate of the past century would result only in a sea level rise of about 3-4 inches per generation.
Picture
Figure 9. Sea level rise at Key West, Florida from tidal gauge records (Blue curve); sea level rise projected to 2100 at the rate over the past century; sea level rise postulated by National Geographic (red line).
Conclusion: The National Geographic projection that two thirds of Florida will be submerge by 2100 is contrary to data and lacks any possible mechanism to increase sea levels more than a few inches. The National Geographic scenario is therefore totally without any credibility. 

5.  Are the National Geographic statements “…higher seas will extend the ruinous reach of storm surges.” and “By the end of the century a hundred-year storm surge like Sandy’s might occur every decade or less.” credible?

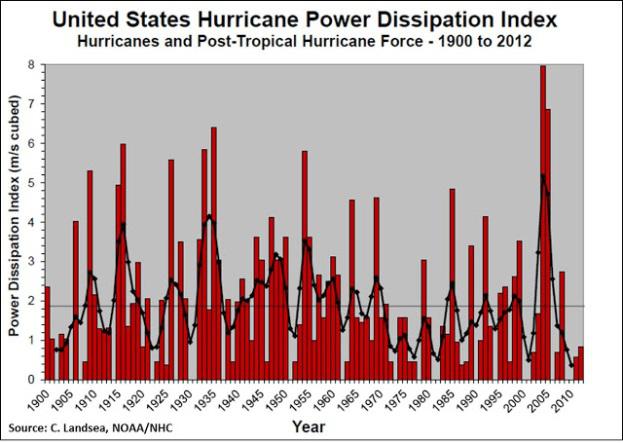
There is no scientific evidence that storm frequency or intensity has increased over the past century. Figure 10 shows no increase in hurricane power dissipation index since 1900 and the US has experienced the longest period with no hurricanes making landfall (the Sandy storm was not strong enough to be considered a hurricane).
Picture
Figure 10. Hurricane index for the US since 1900.
Conclusion: The National Geographic conclusion that higher sea levels“higher seas will extend the ruinous reach of storm surges” is not credible because (1) sea level rise is too small to significantly affect storm surges, and (2) the hurricane strength index is now lower than it was earlier in the century.

6.  “by 2070, 150 million people in the world’s large port cities will be at risk from coastal flooding, along with $35 trillion worth of property.

As shown in the data presented above, none of the National Geographic sea level projections are even remotely believable and sea level projections based on tide gauge records for the past century indicate that sea level will most likely rise 4-6 inches by 2070. 

Conclusion: The National Geographic contention that 150 million people and $35 trillion worth of property is nothing more than a fairy tale, totally contrary to data that indicates that sea level will rise only a few inches by 2070.

7.  “…carbon dioxide in the atmosphere will reach around a thousand parts per million by the end of the century,” “According to the U.S. Geological Survey, sea level on an iceless Earth would be as much as 216 feet higher than it is today. It might take thousands of years and more than a thousand parts per million to create such a world—but if we burn all the fossil fuels, we will get there.”

The National Geographic issue contains many elaborately constructed images under the header of “If all the ice melted,” depicting submergence of extensive coastal areas all over the world and contending that “if we burn all the fossil fuels, we will get there.” What’s wrong with this? For openers, it would require melting of the entire Antarctic ice sheet, the Greenland ice sheet, and all of the world’s ice caps and alpine glaciers. Is this possible? Considering the data presented above, it is, of course ridiculous with no trace of credibility. In addition, the Antarctic ice sheet has not melted in 15 million years, including during many interglacial periods when global temperatures were significantly higher than at present for thousands of years.

Summary of conclusions: From the evidence presented above, the obvious conclusion is that the National Geographic article is an absurd fairy tale, completely unsupported by any real scientific data and directly contrary to a mountain of contrary evidence.

Don J. Easterbrook is professor of geology at Western Washington University.
1 Comment

The Tangled Web They Weave

10/20/2013

0 Comments

 
WE saw an article over at WhatcomWatchdog that you may have missed:

I spent some time looking into the background of the PowerPastCoal.org campaign.  I thought I might find out who exactly they are.  I'm sure glad I did some more research because I discovered a tangled mess of organizations involved.

My original assertion was that this organization was a part of the Wild Earth Guardians Power Past Coal campaign.   I mean really, they have the same name!

Looking further into the WEG website I see that they (WEG) " heartily endorse and are a part of 350.org, a broad-based coalition to bring carbon dioxide down to safe levels".  Not sure who 350.org is but they just happen to be listed first on the list of organizations making up PowerPastCoal.org.

So I went ahead and looked up who the website (powerpastcoal.org) is registered to.  Lo and behold it's registered to someone in New Hampshire with a 350.org email address.  Very curious since their website claims that they are an organization that "acts locally". 

350.org  keeps who they really are private by using "Moniker Privacy Services" as as their registrant name.  Hmmmmm?  Why the secrecy?
Picture
Continue reading...   

The gist of the story is that we have a large number of "non profit" organizations contributing money to influence our local elections anonymously, and it isn't easy to track. In fact, it's very confusing. Most people wouldn't bother. Thanks to WhatcomWatchdog for even attempting it.

0 Comments

The 2013 IPCC Report: Facts vs. Fiction

10/18/2013

0 Comments

 
By Don J. Easterbrook, Ph.D.

Mark Twain popularized the saying: “There are lies, damned lies, and statistics.” After reading the recently released IPCC report, we can now add, “There are liars, damn liars, and IPCC.” When compared to the also [recently published 1000+-page volume of data on climate change [http://climatechangereconsidered.org/]] with thousands of peer-reviewed references, by the Nongovernmental International Panel on Climate Change (NIPCC), the inescapable conclusion is that the IPCC report must be considered the grossest misrepresentation of data ever published.

As MIT climate scientist Dr. Richard Lindzen stated, “The latest IPCC report has truly sunk to the level of hilarious incoherence—it is quite amazing to see the contortions the IPCC has to go through in order to keep the international climate agenda going.”

From the IPCC 2013 Report:
Picture
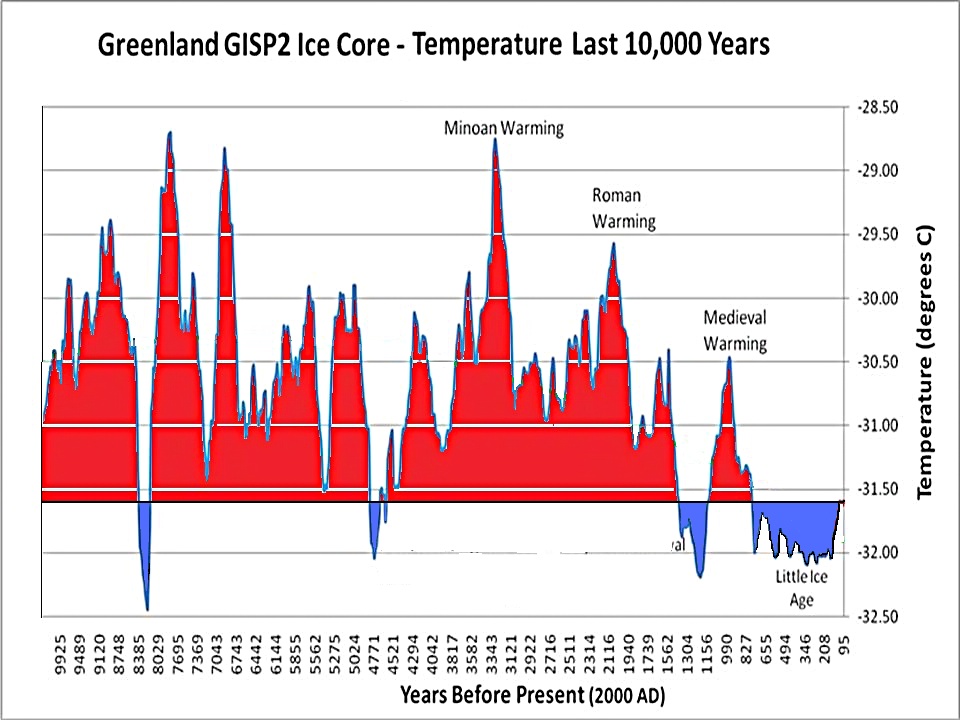
After all these years, IPCC still doesn’t get it—we’ve been thawing out from the Little Ice Age for several hundred years but still are not yet back to pre-Little Ice Age temperatures that prevailed for 90% of the past 10,000 years. Warming and cooling has been going on for millions of years, long before human-caused CO2 could have had anything to do with it, so warming in itself certainly doesn’t prove that it was caused by CO2.

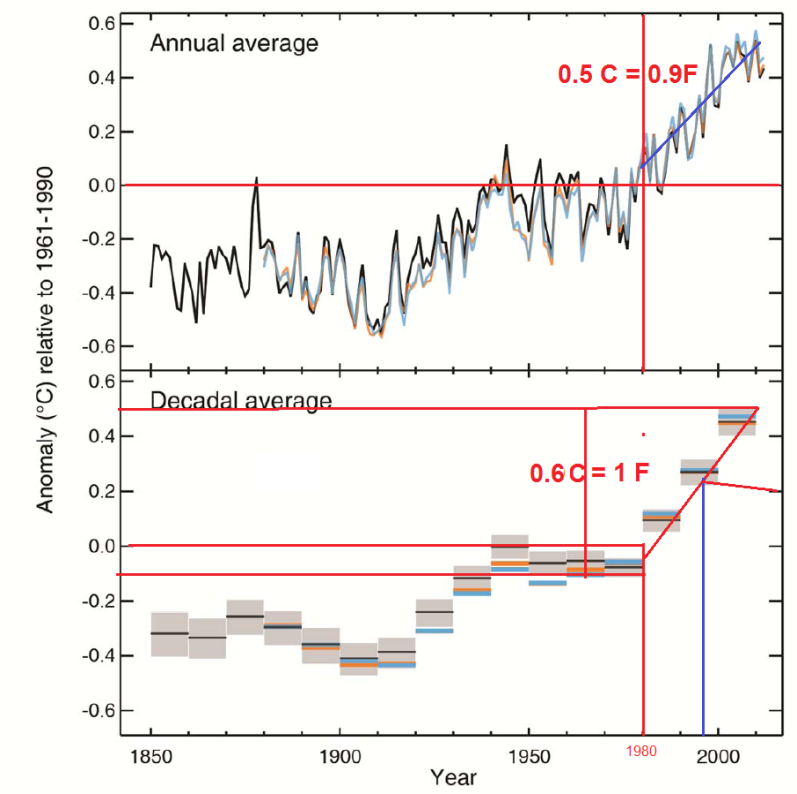
The IPCC’s misrepresentation of data is blatantly ridiculous. In Fig. 1, the IPCC report purports to show warming of 0.5°C (0.9°F) since 1980, yet surface temperature measurements indicate no warming over the past 17 years (Fig. 2) and satellite temperature data shows the August 13 temperature only 0.12°C (0.21°F) above the 1980 temperature (Spencer, 2013). IPCC shows a decadal warming of 0.6°C (1°F) since 1980, but the temperature over the past decade has actually cooled, not warmed.
Picture
Fig 1. IPCC graph of temperatures.
Picture
Fig. 2. Measured surface temperatures for the past decade (modified from Monckton, 2013)
From the IPCC Report:
Picture
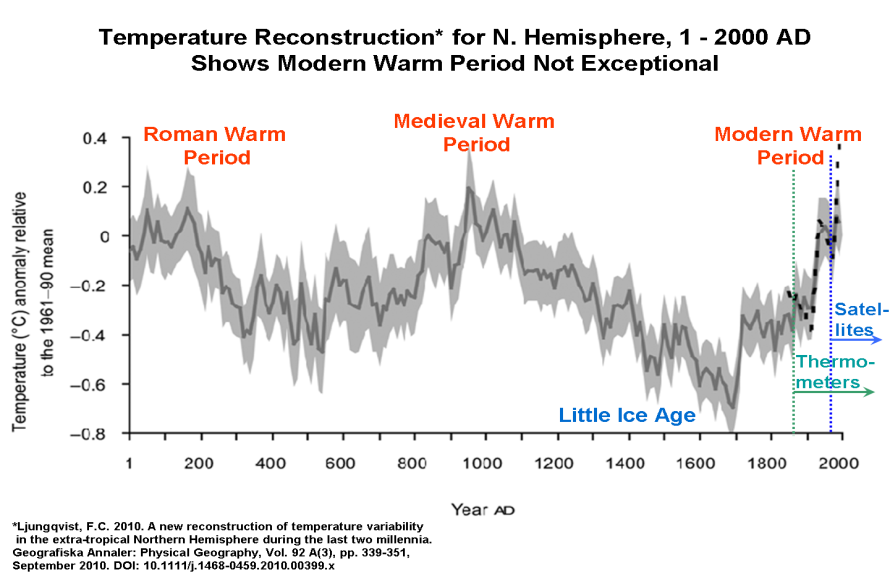
There just isn’t any nice way to say this: that is an outright lie. A vast published literature exists showing that recent warming is not only not unusual, but more intense warming has occurred many times in the past centuries and millennia. As a reviewer of the IPCC report, I called this to their attention, so they cannot have been unaware of it. For example, more than 20 periods of warming in the past five centuries can be found in the Greenland GISP2 ice core (Fig. 3) (Easterbrook, 2011), the Medieval and Roman Warm Periods were warmer than recent warming (Fig. 4), and about 90% of the past 10,000 years were warmer than the present (Fig. 5).
Picture
Figure. 3. More than 20 periods of warming in the past 500 years (Greenland GISP2 ice core, Easterbrook, 2011)
Picture
Figure 4. Temperatures of the Medieval and Roman Warm Periods were higher than recent temperatures.
Picture
Figure 5. ~90% of temperatures during the past 10,000 years were significantly warmer than recent warming (Cuffy and Clow, 1997; Alley, 2000).
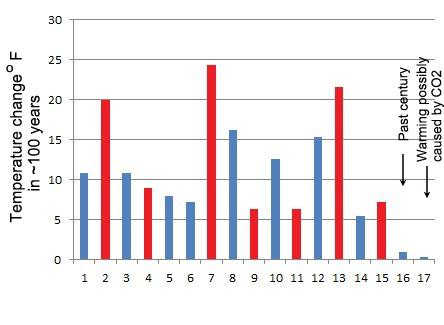
Not only was recent warming not unusual, there have been at least three periods of warming or cooling in the past 15,000 years that have been 20 times more intense, and at least 15 have been five times as intense (Easterbrook, 2011).
Picture
Figure 6. Intensity of warming and cooling in the past 15,000 years (Easterbrook, 2011)
From the 2013 IPCC Report:
Picture
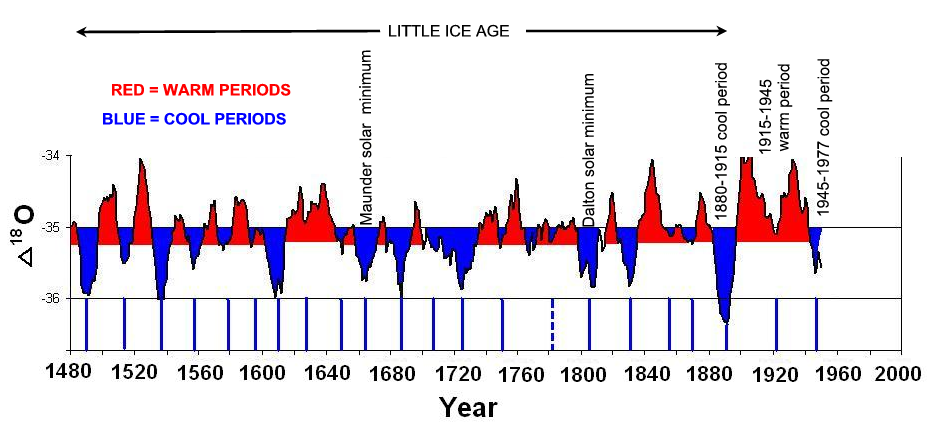
As shown by the figures above from peer-reviewed, published literature, this statement is false. No one disputes that the climate has warmed since the Little Ice Age of approximately 1300-1915 AD—we are still thawing out from it. Virtually all of this warming occurred long before CO2 could possibly be a causal factor.

From the 2013 IPCC Report:
Picture
This is a gross misrepresentation of data. The Antarctic ice sheet has not been losing mass—the East Antarctic ice sheet, which contains about 90% of the world’s fresh water, is not melting—it’s growing! The same is true for Antarctic shelf ice. The only part of Antarctica that may be losing ice is the West Antarctic Peninsula, which contains less than 10% of the Antarctic ice. Temperature records at the South Pole show no warming since records began in 1957.

Some melting occurred in Greenland during the 1978-1998 warming, but that is not at all unusual. Temperatures in Greenland were warmer in the 1930s than during the recent warming, and Greenland seems to be following global warming and cooling periods.

Arctic sea ice declined during the 1978-1998 warm period, but it has waxed and waned in this way with every period of warming and cooling, so that is not in any way unusual. Arctic sea ice expanded by 60% in 2013. Antarctic sea ice has increased by about 1 million km2 (but IPCC makes no mention of this!). The total extent of global sea ice has not diminished in recent decades.

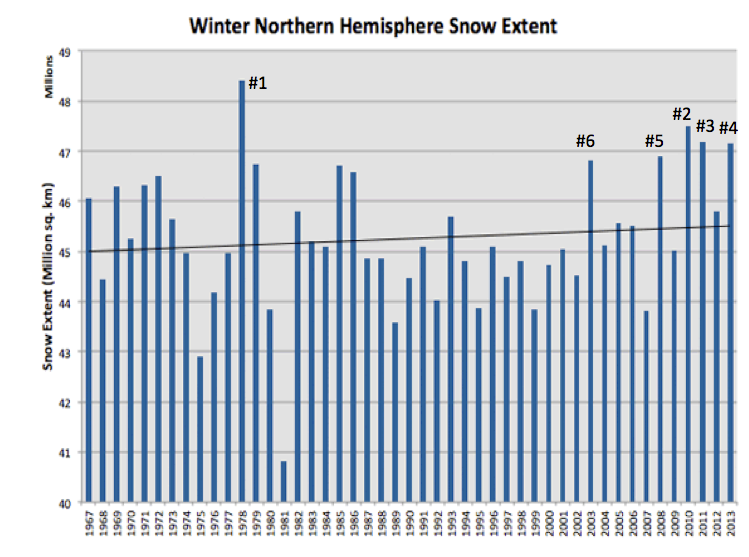
The statement that Northern Hemisphere snow cover has “continued to decrease in extent” is false (despite the IPCC claim of ‘high confidence’). Winter snow extent in the Northern Hemisphere shows no decline since 1967, and five of the six snowiest winters have occurred since 2003 (Fig. 7).
Picture
Figure 7. Snow extent in the Northern Hemisphere since 1967.
The IPCC used only spring snow, which includes March-April, while winter snow cover includes November-April. The IPCC used the spring snow cover data to contend that because of CO2-caused global warming, less snow is occurring on Earth.

The amount of snow cover at any time is always a contest between the amount of snow and rate of melting. Thus, winter snow cover is likely to be most affected by the amount of snow. Not many areas at low elevations get a lot of snow in March and April, so the spring snow cover is likely to be most affected by the rate of snow melt. (Yes, it does snow in March/April and it does melt in Nov-April, but, overall, the dominant processes controlling snow cover are somewhat different). We have all seen bitter winters with large snowfall followed by a warm spring—you can’t really judge how snowy the winter was by how much snow remains at the end of spring. The question is, if you want to judge whether or not snow is disappearing from the Earth, which would you choose, spring snow cover or winter snow cover? The IPCC looked only at the spring snow cover over a two month period and totally ignored the winter snow cover over its six month period. The spring snow cover is more a reflection of how warm the spring was whereas the winter snow cover is likely a better measure of how snowy the winter was. Keeping in mind that the question is whether or not snow is going to be a thing of the past (as contended by some CO2 advocates), including the winter snow cover is critical.

And you can’t fail to take into account that during the past 100+ years we have had two periods of global warming (~1915 to ~1945 and 1978-1998) and two periods of global cooling (~1890 to ~1915 and ~1945-1977), so we shouldn’t be surprised to see trends change with time. We only have satellite coverage for the past 3-4 decades, which happens to coincide with the most recent warm period so we shouldn’t be surprised to see a declining snow cover trend during that period. But what about the preceding cool period (1945-1977) and the warm period from 1915 to 1945? How reliable is the snow cover data from 1920 to 1980? Probably not anywhere near as good as during the satellite era.

The point here is that by using only the spring snow cover to contend that snow is declining does not tell the whole story.

From the 2013 IPCC Report:
Picture
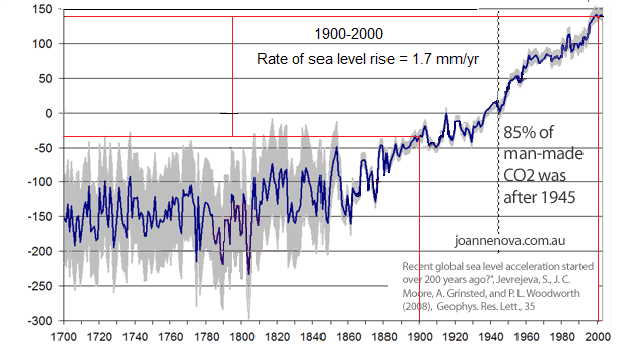
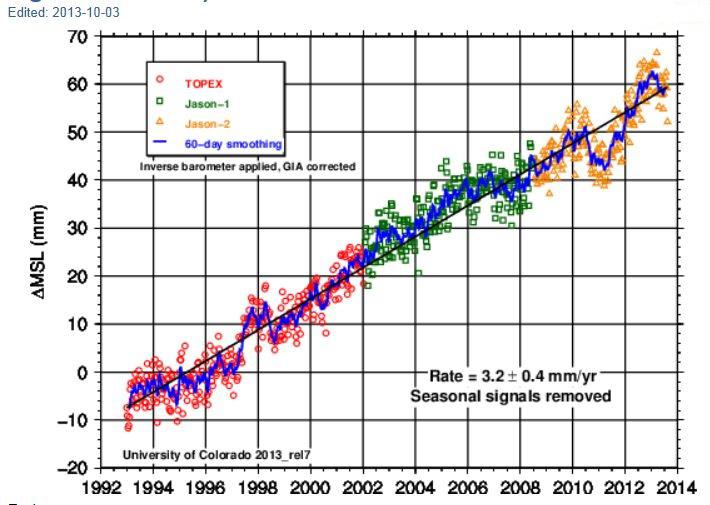
Sea level rise over the past century has varied from 1 to 3 mm/yr, averaging 1.7 mm/yr from 1900-2000 (Fig.8.) Sea level rose at a fairly constant rate from 1993 to about 2005, but the rate of rise flattened out until 2009 (Fig. 9). What is obvious from these curves is that sea level is continuing to rise at a rate of about 7 inches per century, and there is no evidence of accelerating sea level rise. Nor is there any basis for blaming it on CO2, because sea level has been rising for 150 years, long before CO2 levels began to increase after 1945.
Picture
Figure 8. Past sea level rise.
Picture
Figure 9. Sea level rise, 1993-2013. Note the flattening of the curve between 2005 and 2009 and the drop in sea level in 2011-2012. (U. of Colorado)
These are only a few examples of the highly biased misrepresentations of material in the 2013 IPCC report. As seen by the examples above, it isn’t science at all—it’s dogmatic political propaganda.

Don J. Easterbrook is professor of geology at Western Washington University.
0 Comments

Riot at WWU - Outrageous behavior, young voters

10/14/2013

2 Comments

 
There was national coverage of the absolutely outrageous and violent behavior that a mob near Western Washington University engaged in Saturday night. It is not known how many of these rioters are students at Western. The few people who were arrested were reportedly not students. The question remains, where did the nearly 500 rioters come from, exactly?

WE do know that in and around Western, these hundreds of people vote, and that they are constantly courted by environmental PACs and Whatcom Wins!

These little darlings did a nice number on the environment right there. Do they have any idea how big the carbon footprint is for all that beer? And whatever they belch out after drinking it? Not to mention the mess they made of the neighborhood: tearing down stop signs, pointless vandalism, littering ... everywhere. Way to nurture nature! Yelling “Faggot!”  Oh yes, that's a nice tolerant attitude toward homosexuals. All hail diversity! These are the people that Bellingham wants to protect from dangerously negligent landlords. WE wonder who really needs the protection. Al Gore should come down from Mt. Olympus and give them all a very good spanking.
2 Comments

Letter to Patty and Maria

10/11/2013

1 Comment

 
WE noticed this post over on Kakistocracy Report, of a letter to our senators by a local resident. You might find it interesting:

Dear Senator:

I have tried to live by the rules my entire life. My father was a Command Sergeant Major, U.S. Army, who died of combat related stresses shortly after his retirement. It was he who instilled in me those virtues he felt important - honesty, duty, patriotism and obeying the laws of God and of our various governments. I have served my country, paid my taxes, worked hard, volunteered and donated my fair share of money, time and artifacts.

Today, as I approach my 79th birthday, I am heart-broken when I look at my country and my government. I shall only point out a very few things abysmally wrong which you can multiply by a thousand fold. I have calculated that all the money I have paid in income taxes my entire life cannot even keep the Senate barbershop open for one year! Only Heaven and a few tight-lipped actuarial types know what the Senate dining room costs the taxpayers. So please, enjoy your haircuts and meals on us.

Last year, the president spent an estimated $1.4 billion on himself and his family. The vice president spends $ millions on hotels. They have had 8 vacations so far this year! And our House of Representatives and Senate have become America's answer to the Saudi royal family. You have become the "perfumed princes and princesses" of our country.

In the middle of the night, you voted in the Affordable Health Care Act, a.k.a. "Obama Care," a bill which no more than a handful of senators or representatives read more than several paragraphs, crammed it down our throats, and then promptly exempted yourselves from it, substituting your own taxpayer-subsidized golden health care insurance.
But wait! There's more!

Update: It looks like it's posted on the Whatcom Tea Party facebook page as well.
1 Comment

Whatcom County Councilman Under PDC Investigation for Campaign Finance Violations

10/6/2013

6 Comments

 
(Follow-up to Candidate Fails to Account for More Than $7,700)

Ken Mann, Whatcom County Councilman and Chair of the Whatcom County Finance Committee, is under investigation by the Washington State Public Disclosure Commission for significant financial errors and omissions that occurred during his 2009 campaign.

On July 8, 2013 Mr. Chet Dow filed a complaint with the PDC after noticing that Mr. Mann appeared to have lost over $7,700 between the end of his 2009 campaign and the start of his 2013 campaign. After an initial review, the PDC found that the complaint had merit and opened an investigation (PDC case #14-001). Mr. Mann has acknowledged that he is working with the PDC to resolve the matter and that he has responded to multiple requests for bank and financial records. And on September 20th Mr. Mann filed 14 reports with the PDC that should have been filed during his 2009 campaign.

These updated reports may have raised more questions than answers. They show that numerous errors and omissions occurred during his 2009 campaign. They include: 

  • Almost $5,000 in campaign expenses were not reported. 
  • Over 50 contributions were not reported. 
  • 5 reported bank deposits did not actually occur.

For a campaign that had $52,000 in expenses and 400 contributions, these omissions represent a significant percentage of his 2009 campaign finances.

Washington State Law requires transparent and timely reporting of all Campaign Finances (RCW 42.17A). Failure to do so can result in significant fines. The PDC rules state that a typical fine for 3 late reports is $1,100 (WAC 390-37-155). For situations involving more than 3 late reports the rules instruct that the Commission “shall assess successively increased penalties for succeeding violations …” (WAC 390-37-182(2)(c)). Mr. Mann could be in for a whopper of a fine.

A carefully documented analysis of Mr. Mann’s errors and omissions can be found at http://www.PdcProblem.com.

For more information please contact:
Chet Dow (360) 592-4345, Complainant
Bill Crawford (360) 255-1625, Analyst for the Complainant
Kurt Young (360) 664-8854 or (360) 753-1111, PDC Compliance Officer assigned to the investigation
Philip Stutzman (360) 664-8853 or (360) 753-1111, PDC Director of Compliance
6 Comments

Got The Government Shutdown Blues?

10/5/2013

1 Comment

 
Out of money back in Washington D.C. are they?  In the midst of all the shallow dramatics, bleating, and bile WE thought it was time to haul this treat back out again.  It explains how we've really come to this situation, given the virtually unrestrained credit increases and years of unsustainable spending...
Also see [click].  Good government WE could handle.  The free-lunch set has got to go.
1 Comment
    WE Dredge!
    Picture
    Posting Rules:
    This forum is moderated.  Please make an effort to substantiate claims that support opinion.  Gratuitous profanity and ad-hominem attacks will not be accepted.  You can create a "nickname" if you'd like, and you don't have to reveal your e-mail address.   Feel free to share information and your honest thoughts.

    Categories

    All
    Agenda 21
    Best Available Science
    Big Government
    Eco Activism
    Ethics
    Freedom
    Planning
    Property Rights
    Science
    Small Business
    Social Engineering
    Taxes
    Welcome

    Archives

    January 2022
    September 2020
    August 2020
    April 2020
    November 2019
    August 2019
    September 2018
    July 2018
    May 2018
    April 2018
    January 2018
    December 2017
    September 2017
    July 2017
    April 2017
    March 2017
    February 2017
    January 2017
    December 2016
    November 2016
    October 2016
    September 2016
    August 2016
    July 2016
    June 2016
    May 2016
    April 2016
    March 2016
    February 2016
    January 2016
    December 2015
    November 2015
    October 2015
    September 2015
    August 2015
    June 2015
    March 2015
    January 2015
    December 2014
    November 2014
    September 2014
    August 2014
    July 2014
    June 2014
    May 2014
    April 2014
    March 2014
    February 2014
    January 2014
    December 2013
    November 2013
    October 2013
    September 2013
    August 2013
    July 2013
    June 2013
    May 2013
    April 2013
    March 2013
    February 2013
    January 2013
    December 2012
    November 2012
    October 2012
    September 2012
    August 2012
    July 2012
    June 2012
    May 2012
    April 2012
    March 2012
    February 2012
    January 2012
    December 2011
    November 2011
    October 2011
    September 2011
    August 2011
    July 2011
    June 2011


    Automatic Updates

    Do you want to be notified when new content is added to this newsfeed? Most browsers allow you to subscribe to our Really Simple Syndication (RSS) feed. Click on the RSS link below, and follow the instructions.

    RSS Feed

Powered by Create your own unique website with customizable templates.