WE find nothing but bitter irony in the situation that's unfolding 'down south.' And when we say "irony" we mean it this form, as described in the Oxford English Dictionary:
A condition of affairs or events of a character opposite to what was, or might naturally be, expected; a contradictory outcome of events as if in mockery of the promise and fitness of things. (In French, ironie du sort.)
The teachers' union and the Washington Supreme Court have got to stop using kids as pawns this way. And all this is happening in the midst of the "McCleary Case." The irony is obvious; the tragedy is tangible; these educators are such ... tools!
In Washington State, Thousands of Kids Aren’t
Returning to School
The Daily Signal - EDUCATION NEWS
Kelsey Harkness / @kelseyjharkness / September 14, 2015
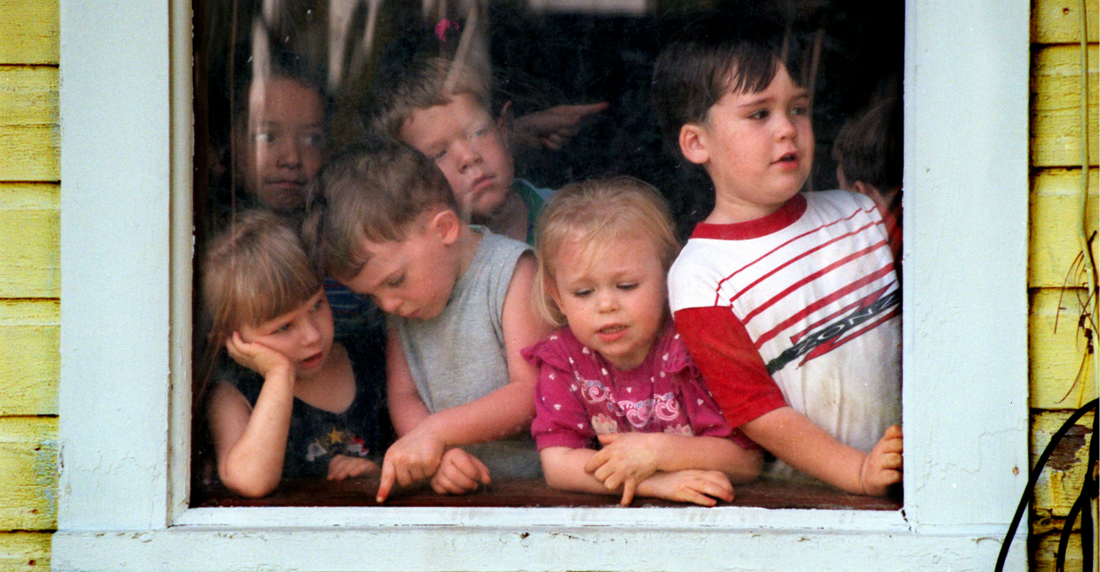
53,000 students in Washington state are stuck at home while teachers go on strike. (Photo: Mike Maple/The Commercial Appeal/Newscom)
As charter school teachers in Seattle are showing up to work despite a court’s ruling their schools unconstitutional, public school teachers in the city are on strike, leaving 53,000 students at home for the first few days of the 2015-16 school year.
“There’s a big irony here right now in Seattle,” said Liv Finne, director of Education for the Washington Policy Center, which advocates for charter schools in the state. “The teachers are on strike in the traditional schools—there’s nobody going to school. Yet, the three charter schools that are in Seattle are open for business.”
The Lawsuit Against Charter Schools
Funding for Washington’s nine charter schools was abruptly cut off on Sept. 4—just days before some schools were set to open—when the state’s Supreme Court ruled them unconstitutional.
Siding with the teachers unions and other organizations bringing the suit, the justices found “charter schools are not common schools” because they are run by independent operators instead of locally elected school boards, as the state’s Constitution requires.
“It’s really disheartening,” Hong-nhi Do, a 27-year-old 5th and 6th grade learning specialist at Rainier Prep charter school told The Daily Signal. “I think people are choosing politics over kids and families.”
Despite the ruling—and the future of their jobs at stake—Do and her fellow charter educators arrived to school this week, opening their doors to the 1,300 students they serve. In order to do so, they secured a $14 million private donation that will get them through the school year.
“All of our teachers are showing up,” Do said. “Every single one of us is fighting so hard and wants to do whatever it takes to keep our school open.”
After funding for the 2014-15 school year runs out, no one knows what will happen. Charter school operators, along with state lawmakers, are scrambling to figure that out.
One school, Seattle’s Summit Sierra High School, got creative in order to stay open, and had its 120 students fill out forms for homeschooling, the Seattle Pi reported.
The Strike
The charter school ruling coincided with a strike that shut down schools for Seattle’s 53,000 public school students. The strike came after negotiations failed between the Seattle Educators Association and the Seattle School Board.
“Schools will be closed until further notice,” Seattle Public Schools states on its website.
Public school teachers have a variety of demands, including, a “substantial” pay raise, compensation for an additional 20 minutes of instructional time for students, “fair” evaluations and “workload relief.”
According to the non-profit education news site The Seventy Four, Seattle teachers’ median pay is $60,400, not including benefits, which exceeds the city’s median income of $43,200.
The Daily Signal reached out to the union for further explanation of its demands, but they did not reply.
The Conflict
The Seattle Educators Association feeds into the Washington Education Association, which was one of the organizations behind the charter school lawsuit. Ties between the union and the nine Supreme Court justices raised questions after the charter schools ruling came down.
“It’s the worst instance of machine-politics and kids have to be the causality of it,” Derrell Bradford, a Democrat who serves as executive director of NYCAN, told The Daily Signal.
You have a statewide referendum—it went to the voters and the voters said yes, you’ve got judges who are elected—who are bankrolled by the Washington Education Association, so they’re bought and paid for—who give a ruling based on local control and local elected governance that actually circumvents the local governance of the people because they had a statewide referendum.
Voters in Washington approved a charter school law in 2012, which allowed for the creation of up to 40 charter schools.
According to Finne, director of Education for the Washington Policy Center, four out of the nine Supreme Court justices received the maximum campaign contributions from the Washington Education Association union in 2014.
· Justice Mary I. Yu – $1,900 from Washington Education Association Political Action Committee.
· Justice Mary E. Fairhurst – $1,900 from Washington Education Association.
· Justice Charles W. Johnson – $1,900 from Washington Education Association Political Action Committee.
· Justice Debra L. Stephens – $1,900 from Washington Education Association Political Action Committee.
In 2012, the three remaining justices received maximum political contributions from the same union.
· Justice Susan J. Owens – $1,800 from Washington Education Association.
· Justice Stephen C. Gonzalez – $1,800 from Washington Education Association Political Action Committee.
· Justice Sheryl Gordon McCloud – $1,800 from Washington Education Association Political Action Committee.
In Washington, Supreme Court justices must run for office. Although they are prohibited from soliciting donations, their campaigns may receive them, so long as they abide by the guidelines.
“This is just the natural result of the leadership we’ve had,” Finne said.
A Fight for Control
The dueling situations, Bradford said, “really show you what these people want. And it’s not local control—it’s their control and their control only.” He added:
On one hand, [the unions] are saying, ‘We need elected school boards, we’ve got to have elected governance, and charter schools circumvent that.’ On the other hand, when they can’t get the deal they want from the elected governance they have, they strike and leave 53,000 kids in the lurch. They don’t want elected governance, they want their governance and when they can kill the competition, the next thing they do is jack up the price. That just hasn’t been, can’t be, and won’t be the best thing for every kid. It’s okay for some kids, but it’s not the best thing for every kid.
A spokesperson for Washington’s Supreme Court declined to comment on allegations surrounding union influence on the nine justices. On Friday, Washington Attorney General Bob Ferguson announced his plans to ask the court to reconsider its decision. The ruling, he said, “also unnecessarily calls into question the constitutionality of a wide range of other state educational programs.”
Programs like Running Start and Washington State Skills Centers provide career and technical education to high school students via state funds, but aren’t controlled by locally elected school boards. For this reason, critics feel the justices targeted charter schools for political purposes.
For some Do, a teacher at Rainier Prep, the situation hits close to home. Do grew up in the same town her charter school is located, and says she “knows what the public schools were like.”
“I have a lot of friends in the area who are now incarcerated or wish they got more out of their education here,” she said. “To see us not be able to accept something that is new and innovative is really disheartening.”


 RSS Feed
