Recently, on August 27, the Bellingham Herald ran a panicky climate change story that featured photos of Oliver Grah who works for the Nooksack Tribe and others poking at Mt. Baker's glaciers. The article included dire predictions, like: “At the rate it’s losing mass, it won’t make it 50 years,” said Pelto, a glaciologist who returned this month for the 32nd year to study glaciers in the North Cascades range. This is a dying glacier,” he said."
WE just learned that on September 8 the Seattle Times ran a story heavily tied to this same tale (Grah and Pelto), citing them and expanding the theme. Maybe you can see the Seattle Times article here for yourself.
The public is being fed dramatic stories by these newspapers, loaded with hyperbole but no evidence. Check out the evidence. (Editors at the Herald and Times - WE ask, 'Do you fact-check your "science stories" at all?')
Mt. Baker glaciers disappearing? A response to the Seattle Times
by Don J. Easterbrook
at Watts Up With That? September 13, 2015
The headline of the September 8, 2015 Seattle Times states:
‘Disastrous’: Low snow, heat eat away at Northwest glaciers
“Glaciers across the North Cascades could lose 5 to 10 percent of their volume this year, accelerating decades of steady decline. One scientist estimates the region’s glaciers are smaller than they have been in at least 4,000 years.” “The best word for it is disastrous,” said Pelto”
http://www.seattletimes.com/seattle-news/science/disastrous-low-snow-heat-eat-away-at-northwest-glaciers/
This was a multi-page story with numerous photographs and many predictions that glaciers in the North Cascade Mts. will be gone in 50 years. Having just finished a major analysis of Mt. Baker’s glaciers dating back thousands of years, I thought, what kind of nonsense is this? So I put together some of the data on Mt. Baker glaciers that will soon be published.
Photos and maps from a large collection dating back to 1909 document exactly what Mt. Baker glaciers have done in the past. What these photos and maps clearly show is the Mt. Baker glaciers reached their maximum extent of the past century in 1915 at the end of the 1880 to 1915 cold period. The glaciers then melted back strongly during the 1915 to 1950 warm period. The climate then turned cool again, and Mt. Baker glaciers advanced strongly for 30 years. In 1977, the climate turned warm again and since about 1980, glaciers have been retreating again. However, photos and maps prove that all Mt. Baker glaciers are more extensive today than they were in 1950. Here are a few examples.
Roosevelt and Coleman glaciers
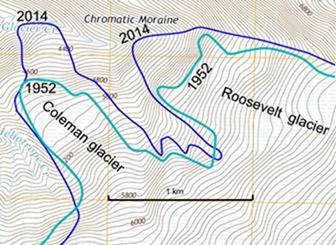
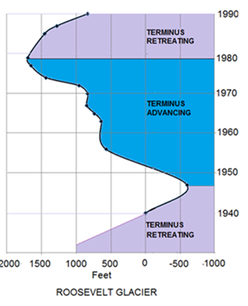
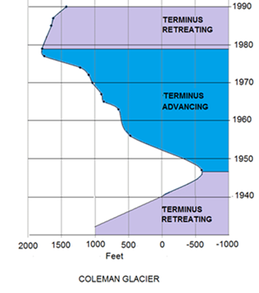
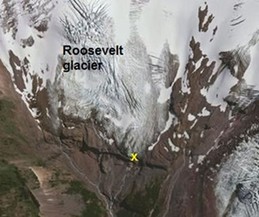
Comparison of the position of the terminus of the Roosevelt glacier on USGS topographic maps of 2014 (blue line) and 1952 (green line) (Fig. 1). Both the Coleman and Roosevelt glaciers are more extensive now than they were in 1952. Figure 2 shows the advance and retreat of the two glaciers measured from vertical air photographs.
Deming glacier
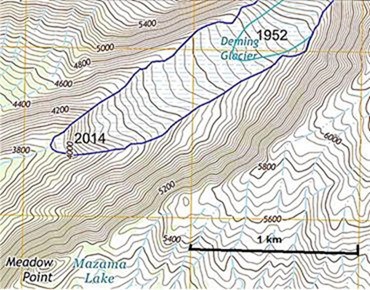
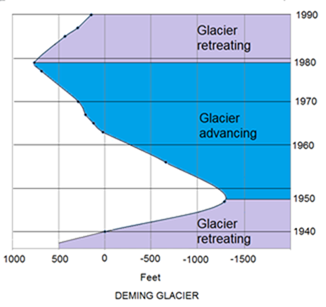
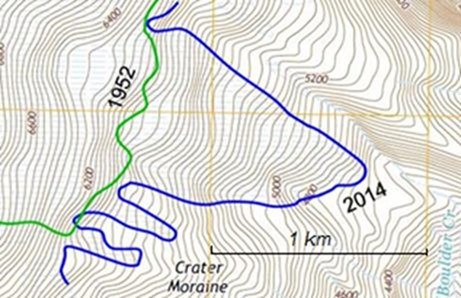
Comparison of the position of the terminus of the Deming glacier on USGS topographic maps of 2014 (blue line) and 1952 (green line) (Fig. 4) show that the glacier was more extensive in 2014 than it was in 1952. The right side of the figure shows that rates of advance and retreat of the Deming glacier from 1940 to 1990 (plotted from data in Harper, 1992).
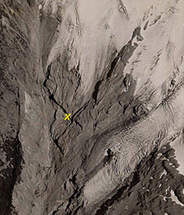
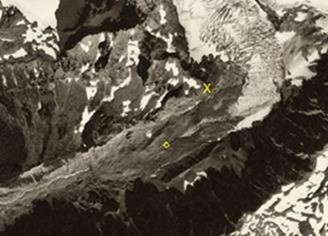
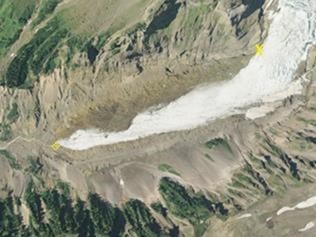
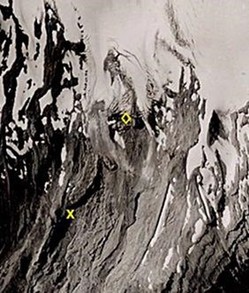
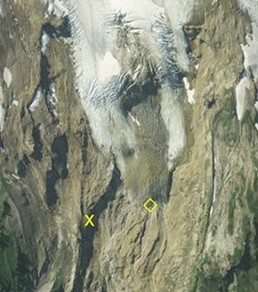
Photographs of the Deming glacier 2011-2015 confirm that the glacier is more extensive now than it was in 1950-52. In the photos below the X is a point of reference and the yellow diamond is the terminus. The 2011-2015 terminus is far downvalley (see map) from it’s 1950-52 position.
Boulder glacier
Comparison of the position of the terminus of the Boulder glacier on USGS topographic maps of 2015 (blue line) and 1952 (green line) (Fig. 6) show that the glacier is more extensive now than it was in 1952.
Photographs of the Boulder glacier 2014 confirm that the glacier is more extensive now than it was in 1950-52. The present is far downvalley (see map) from its 1950-52 position.
All of Mt. Baker’s other glaciers show the same thing. They are all more extensive now than they were in 1952 and nothing unusual is happening to them—they have been where they are now many times before. Data similar to that shown here for the Coleman, Roosevelt, Deming, and Boulder glaciers is also available for the Easton, Squak, Talum, Park, Rainbow, and Mazama glaciers.
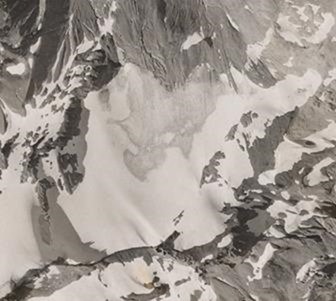
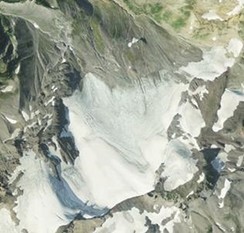
The Seattle Times states that “Riedel estimates the region’s glaciers are smaller than they have been in at least 4,000 years.” However, the photos and maps of the Sholes glacier, the featured in the Times article, below prove that these claims are totally false˗˗the Sholes glacier has not changed at all in the past 70 years.
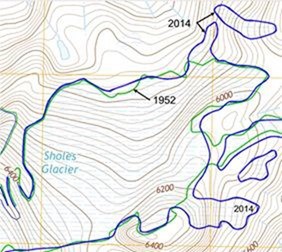
These photos prove that the Sholes glacier today is identical to what it was in 1947. In addition, comparison of the glacier terminus on USGS topographic maps of 1952 and 2014 (below) show that the Sholes glacier has not changed since 1952.

 RSS Feed
